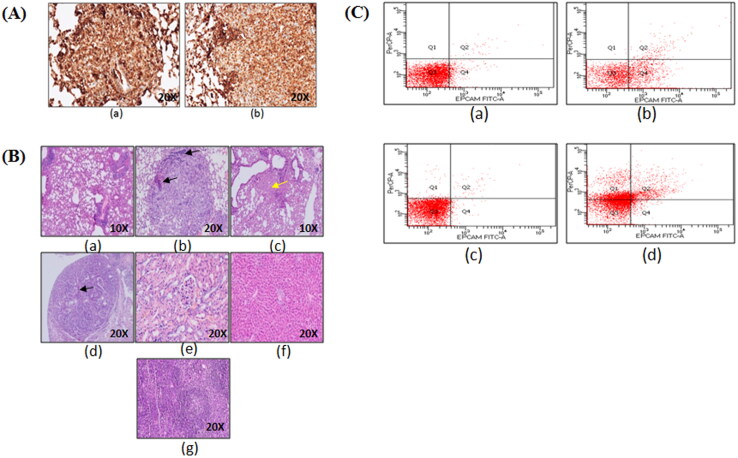
Figure 5.
Immunohistochemistry and flow cytometric analysis of lung adenocarcinoma lesions. (A) Representative images of TTF-1+ lung tumor lesions at (a) 6 months latency period and (b) 10 months latency period. (B) Representative H&E lung tumor lesions of (a) control group; (b) untreated group; (c) free actinonin-treated group; (d) nanoformulated actinonin-treated group. H&E of other vital organs (e) kidney, (f) liver and (g) spleen. Black arrows indicate lymphocytic infiltration and yellow arrow indicate apoptosis.(C) The excised tumors screened for presence of EpCAM and CD45 positive cells. (a) Control EpCAM+, (b) Tumor EpCAM+, (c) Control CD45+, (d) Tumor CD45+.

