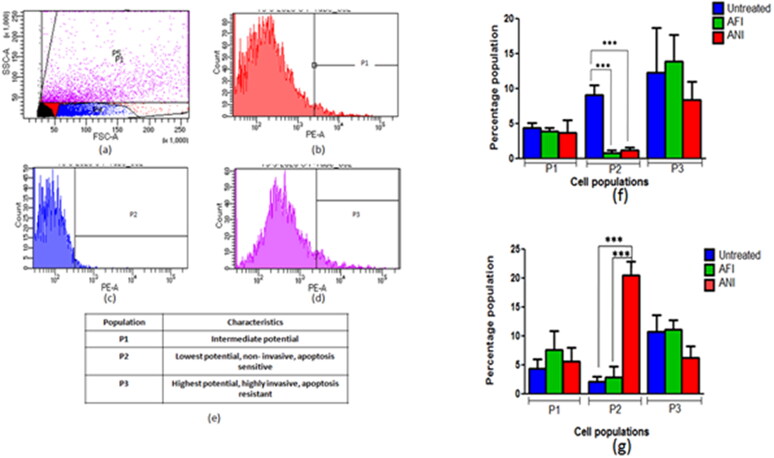
Figure 7.
Selection of population based on mitochondrial membrane potential. (a) Scatter plot with all subpopulations, (b) cells with higher to intermediate fluorescence intensity (P1), (c) cells with lowest fluorescence intensity (P2), (d) cells with highest fluorescence intensity (P3), (e) tabulated subpopulations with mean fluorescence intensities and percentage in parent population. The percentage population representing TMRM positivity in (f) actinonin treatment animal group of 6 months latency period and (g) actinonin treatment animal group of 10 months latency period. UT – untreated, AFI – free actinonin i.p and ANI – nanoformulated actinonin i.p. Values are mean ± SE of 3–5 animals. ***p ≤ 0.01.

