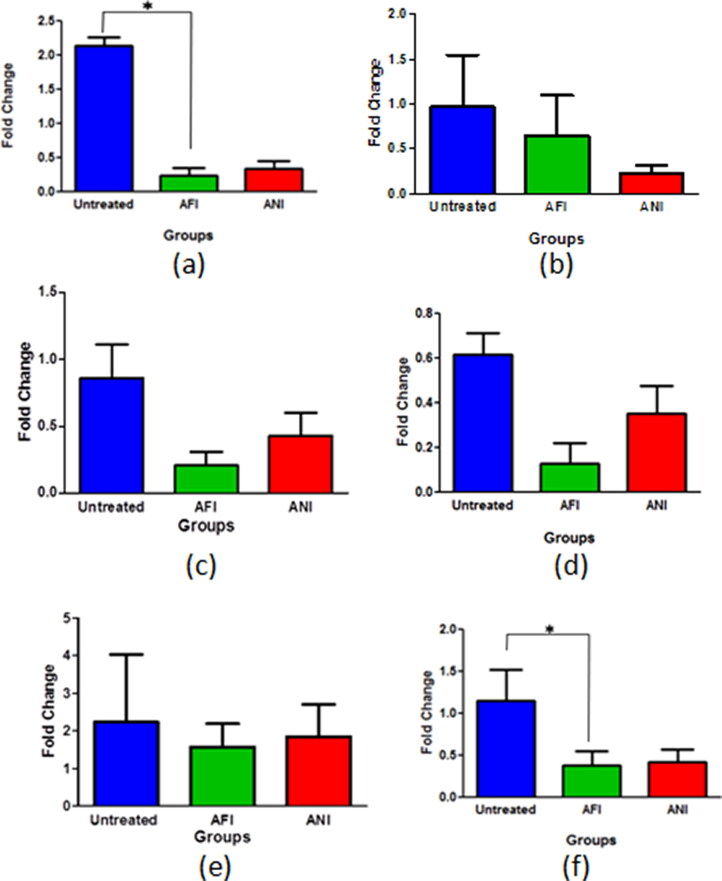
Figure 8.
Gene expression analysis of lung adenocarcinoma lesions. The egfr mRNA levels at (a) 6 months latency period and (b) 10 months latency period. The folR α mRNA levels at (c) 6 months latency period, (d) 10 months latency period. The pdf mRNA levels at (e) 6 months latency period (f) 10 months latency period. UT – untreated, AFI – free actinonin i.p. and ANI – nanoformulated actinonin i.p. Values are mean ± SE of 3–5 animals *p ≤ 0.05.

