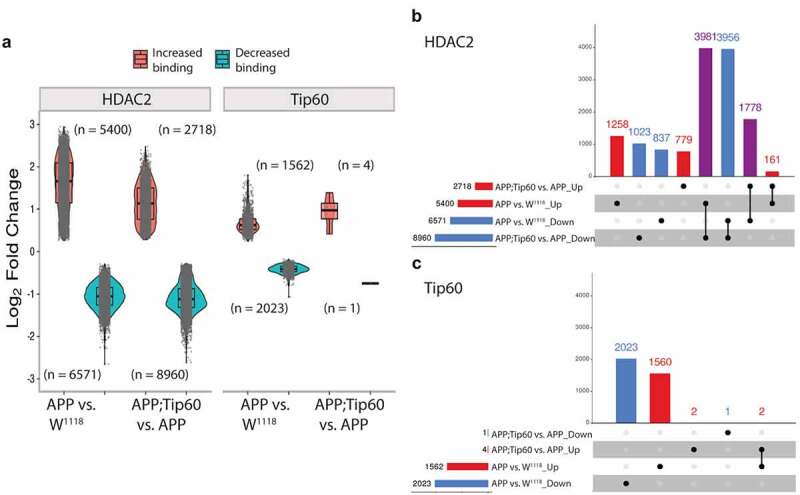
Figure 4.

Increased Tip60 protects against enhanced HDAC2 enrichment in APP larval heads. (a) Log2 fold changes of differentially bound peaks (padj ≤0.05) of HDAC2 and Tip60 in APP vs. w1118 and APP;Tip60 vs. APP. APP-induced changes (APP vs. w1118) were prominent in both HDAC2 and Tip60 samples, while Tip60-induced changes (APP;Tip60 vs. APP) were prominent only in HDAC2 samples. (b and c) The upSet plot represents the distribution and intersection of differentially bound peaks between APP vs. w1118 and APP;Tip60 vs. APP from HDAC2 (b) and Tip60 (c) samples. Rows represent the number of peaks in each comparison (APP vs. w1118 and APP;Tip60 vs. APP), and columns represent the number of peaks per interaction. The red and blue bars represent the increased and decreased binding of HDAC2 or Tip60, respectively. The black filled dots indicate the association between rows. The red and blue columns represent peaks unique to a given comparison, while the purple columns represent the peaks rescued by Tip60 expression.
