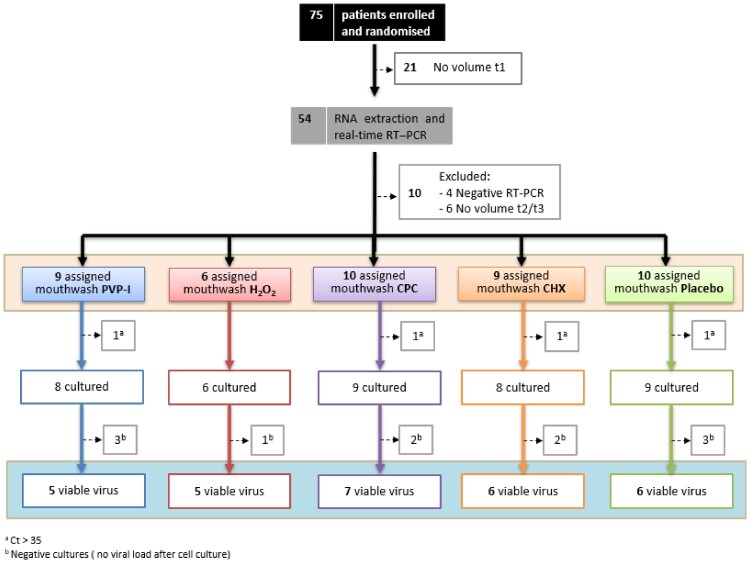
Figure 1.
Trial profile. Diagram showing the number of patients enrolled and randomized, excluded for not having sufficient saliva volume or negative to RT-qPCR in the baseline samples, and the total evaluated patients in which total viral load (orange square) and viable (infective) viral load (blue square) were determined. The numbers of inpatients assigned to each of the different treatment groups are represented inside boxes of different colours. PVP-I (povidone-iodine) in blue, Hydrogen peroxide (H2O2) in red, CPC (cetylpyridinium chloride) in purple, CHX (chlorhexidine) in orange, and Placebo (distilled water) in green. t1: basal time point. a Number of patients excluded from the cell culture assays for low salivary viral load (Ct value > 35 in the RT-qPCRs in the baseline saliva sample). b Number of patients without detectable viral load after cell culture in the baseline saliva sample.

