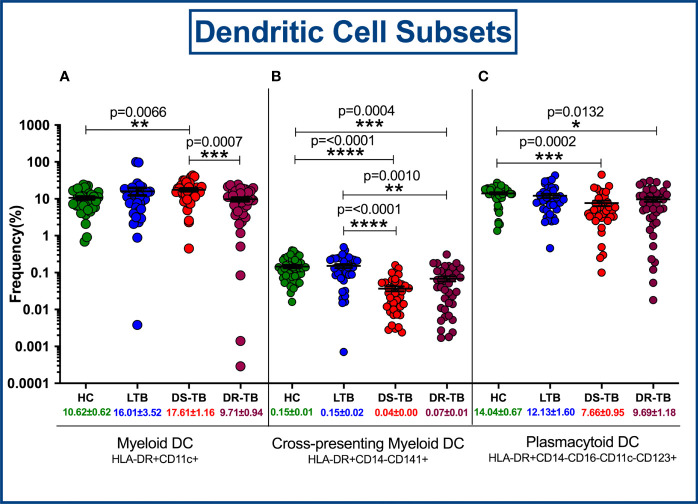
Figure 5.
Frequency distribution of dendritic cell subsets; HLA-DR+CD11c+ myeloid DCs (A), Cross-presenting myeloid DCs (B) and Plasmacytoid DCs (C) among four groups. p value less than 0.05 is considered as statistically significant and the level of significance denoted as * [p<0.01(*); p<0.001(**); and p<0.0001(***)]. The significance level with their p values are mentioned in the graph. Highly significant ones are mentioned as **** where p=<0.0001.

