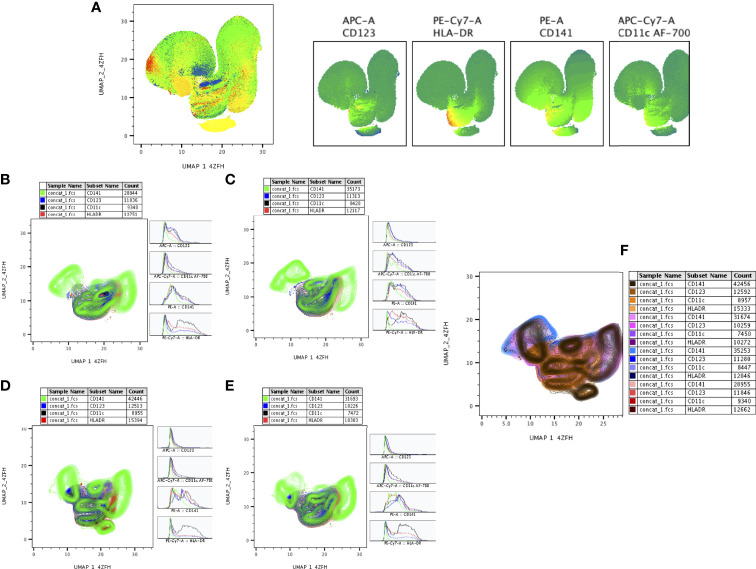
Figure 7.
UMAP analysis of DC subsets. HLADR+ (10,000 cells) were down sampled for monocytes/granulocytes and performed (A) unsupervised (UMAP (UMAP_1_4ZFH vs UMAP_2_4ZFH) clusters (ungated) and expression of individual DC (CD123, HLADR, CD141, CD11c) markers between the study (DR-TB, DS-TB, LTB, HC) population. (B–E) shows the DR-TB, DS-TB, LTB and HC group expression of DC marker (islands) subsets using contour plots. (F) shows merged contour plot expression of DC subsets among the study individuals.

