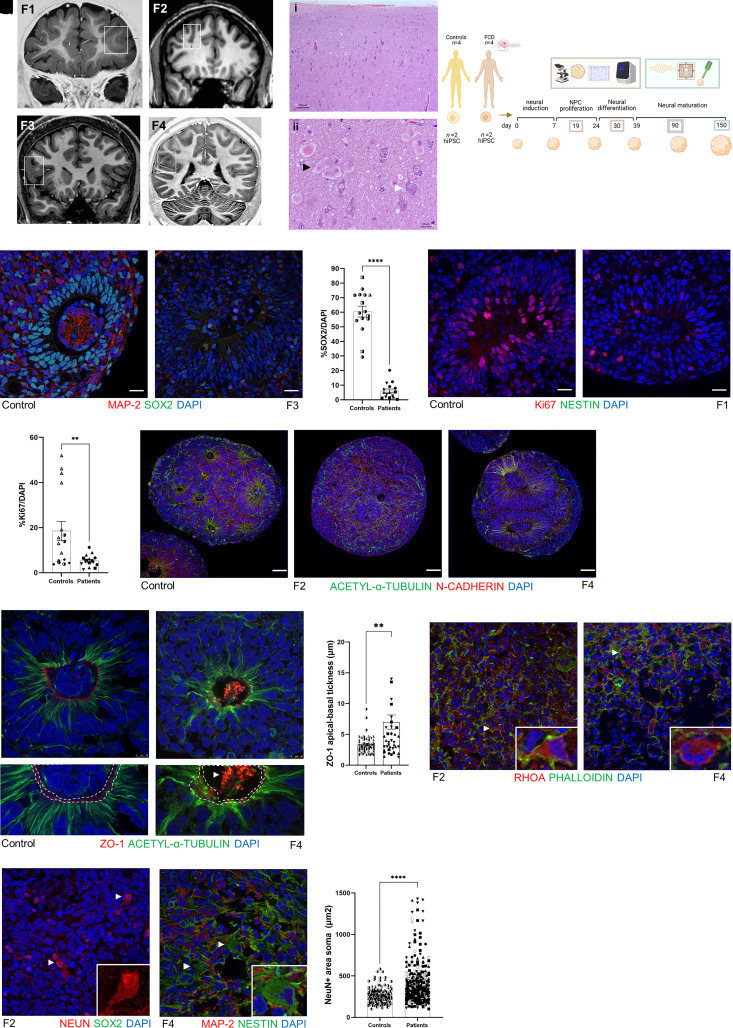
Figure 1.
Cellular characterization of FCD cortical organoids. (A) Coronal T1-weighted MRI from four patients with FCD type II. The square in each image indicates the abnormality suggestive of FCD. Patient F1, 5 years of age, the square shows increased cortical thickness and blurring of the cortical-subcortical transition in the anterior part of the left middle and inferior frontal gyrus and orbital gyri; Patient F2, 37 years of age, the square shows an abnormal deep sulcus in the transition of the right superior and middle frontal gyrus; Patient F3, 15 years of age, the square shows an increased cortical thickness of the right inferior frontal gyrus; and Patient F4, 19 years of age, the square shows increased cortical thickness and blurring of the cortical-subcortical transition in the parietal operculum and posterior insula. (B) Haematoxylin and eosin staining of a specimen from Patient F1 shown in: (i) with cortical dyslamination; and (ii) the presence of balloon cells (black arrow) and dysmorphic neurons (white arrow). (C) Schematic representation of the timeline of the cortical organoid generation and the experimental design using four patients with FCD and four healthy controls, with two clones of iPSCs per subject for posterior cortical organoid generation in four time points: 19, 30, 90 and 150 days. Cellular and molecular characterization was performed in 19-, 30- and 90-day-old organoids (represented by beige rectangle), and functional analyses were performed in 90- and 150-day-old organoids (represented by green rectangle). (D and E) Representative micrographs showing proliferating neural progenitor cells (NPC) at the neural rosette stained with SOX2+ (green) and mature MAP2+ neurons (red) from a 30-day-old cortical organoid from (D) WT83 control and (F) Patient F3. (F) Quantification of SOX2+ cells per DAPI+ cells in 30-day-old organoids (n = 4 organoids per experiment per each subject, P < 0.0001). (G and H) Representative micrographs Ki67+ cells (red) at neural rosette staining from 30-day-old cortical organoid from (G) WT83 control and (H) Patient F1. (I) Quantification of Ki67+ cells per DAPI+ cells in 30-day-old organoids (n = 4 organoids per experiment per each subject, P = 0.0044). (J–L) Nineteen-day-old cortical organoid stained with N-cadherin (red) and acetyl-α-tubulin (green), showing that stable microtubules were well organized from the apical to basal surface at neural rosettes in the 4C control (J). (K) In Patient F2 cortical organoids, we noticed fragmented microtubules surrounding the forme fruste neural rosette. (L) Organoids from Patient F4 presented enlarged rosettes with an increased lumen diameter. These two phenotypes were observed in the two different clones of the iPSCs from these two patients (Patients F2 and F4) and in consecutive batches of organoid generation. (M and N) Representative micrographs of ZO-1 (red) and acetyl-α-tubulin (green) immunostaining of 19-day-old cortical organoids, showing a continuous ring of ZO-1 in WT83 control (M; white dashed line; bottom figure represents an enlarged view of M), and a disrupted belt (N; white dashed line; bottom figure represents an enlarged view of N) with a concentration of ZO-1 protein in the middle of the lumen (white arrow) in the F4-derived organoids. (O) Quantification of ZO-1 apical-basal thickness, showing an irregular distribution of ZO-1 reflected in increased thickness in FCD organoids (n = 12 controls organoids, n = 12 patients organoids). (P and Q) Representative micrographs of RHOA (red) and phalloidin (green) immunostaining of 90-day-old cortical organoids. (P) In F2 organoids, the inset shows a neuron compatible with a dysmorphic neuron. (Q) Organoid derived from Patient F4, the inset indicates a round cell with four nuclei, features that indicates a balloon cell. (R) Representative micrographs of NeuN (red) immunostaining of a 90-day-old Patient F2-derived cortical organoid. The arrows and inset indicate neurons with enlarged NeuN+ soma staining that is more intense in the nucleus than the cytoplasm, features compatible with dysmorphic neurons. (S) Representative micrograph of MAP2 (red), and nestin (green) immunostaining of 90-day-old F4 derived cortical organoid. The arrows and inset indicate a nestin+ cell with abnormal soma morphology and a laterally displaced nucleus, features characteristic of a balloon cell. (T) Area of the soma in NeuN+ evidencing that neurons in FCD organoids were twice as large as controls (n = 145 controls, n = 316 neurons patients; mean: 264.2 µm2 controls and mean: 454.6 µm2 patients. Nuclei were stained with DAPI (blue). The results are presented as the mean ± SEM. A one-sample t-test was used to assess statistical significance, *P < 0.05, **P < 0.001, ****P < 0.0001. Scale bar = 100 μm [B(i) and J–L], 10 μm (M and N) or 20 μm (all others). Controls: WT83 clone 1◑, clone 2◐; 4C clone 1◨, clone 2 ◧; 969 clone 1◮, clone 2 ◭, 121 clone 1 ◆ clone 2 ◇; patients: F1 clone 1●, clone 2 ○; F2 clone 1■, clone 2 □, F3 clone 1▲, clone 2 △, F4 clone 1▼, clone 2▽.

