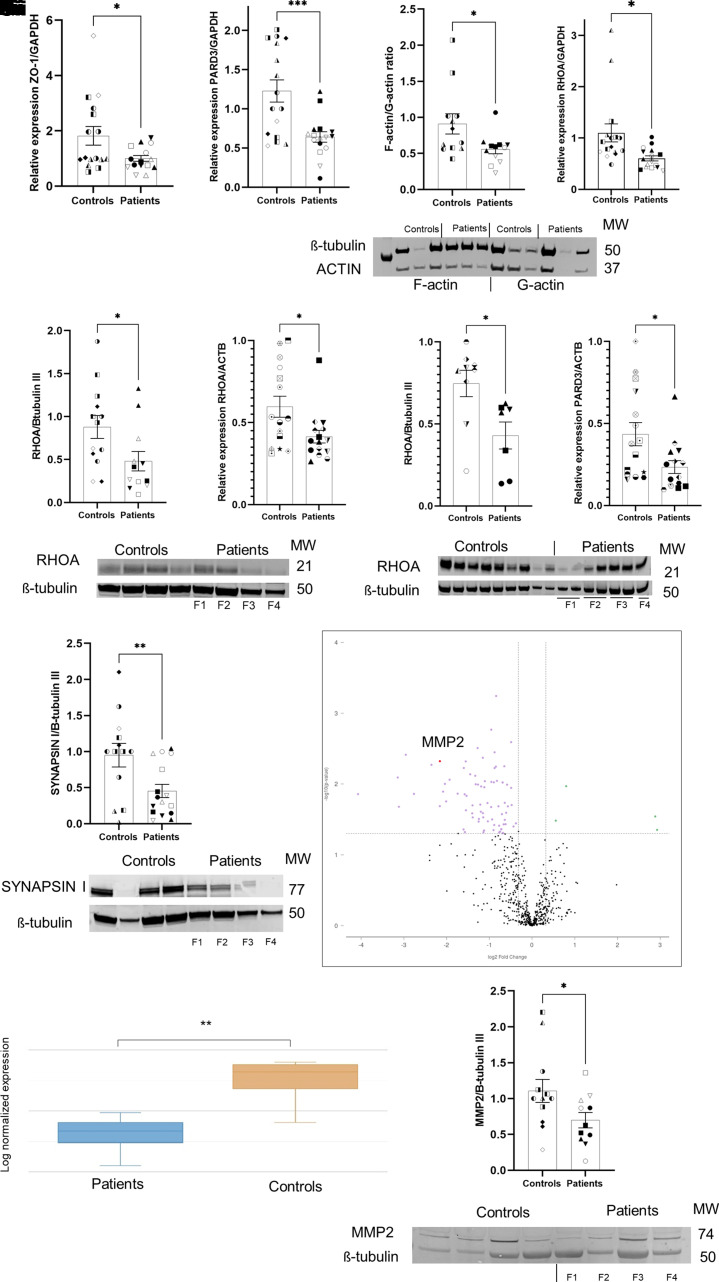
Figure 2.
Molecular characterization of FCD cortical organoids. (A) Relative expression (RT-qPCR) of ZO-1 in 19-day-old-organoid from four independent batches of organoids per subject (n = 16 control and n = 16 patients). Each subject comprised two different clones of iPSCs, with three technical replicates per sample, expression levels were normalized to GAPDH;
P = 0.0387. (B) RT-qPCR of PARD3 in 90-day-old-organoids from four independent batches of organoids per subject (n = 16 controls and n = 16 patients). Each subject comprised two different clones of iPSCs, with three technical replicates per sample, expression levels were normalized to GAPDH;
P = 0.0008. (C) Quantification and western blot of ultrafractionated actin samples (F-actin and G- actin) from 90-day-old organoids; four independent batches of organoids per subject (n = 12 controls and n = 12 patients). Each subject comprised two different clones of iPSCs. The expression levels were normalized to β-tubulin III; P = 0.0312. (D) RT-qPCR of RHOA in 90-day-old-organoids from four independent batches of organoids per subject (n = 16 controls and n = 16 patients). Each subject was composed of two different clones of iPSCs, with three technical replicates per sample, expression levels were normalized to GAPDH;
P = 0.0110. (E) Quantification and western blot of RHOA protein from 90 day-old-organoids; four independent batches of organoids per subject (n = 11 controls and n = 10 patients; without F1 organoids). Each subject comprised two different clones of iPSCs. The expression levels were normalized to β-tubulin III; P = 0.0241. (F) RT-qPCR of RHOA from fresh-frozen brain tissue of patients with FCD type II (n = 15 controls and n = 15; Table 2), with three technical replicates per sample. The expression levels were normalized to ACTB; P = 0.0214. (G) Quantification and western blot of RHOA protein from fresh-frozen brain tissue of patients with FCD type II (n = 7) and controls (n = 9). The expression levels were normalized to β-tubulin III; P = 0.0167. (H) RT-qPCR of PARD3 from fresh-frozen brain tissue of patients with FCD type II (n = 15) and controls (n = 15), with three technical replicates per sample. The expression levels were normalized to ACTB; P = 0.0199. (I) Quantification and western blot of SYNAPSIN I protein from 90-day-old-organoids; four independent batches of organoids per subject (n = 13 controls and n = 16 patients). Each subject comprised two different clones of iPSCs. The expression levels were normalized to β-tubulin III; P = 0.0098. (J–
L) Gene expression analysis based on Nanostring neuropathology panel from 90-day-old organoids, FCD versus control, (n = 4 controls and n = 4 patients; Patients F1, F2, F3 and F4). (J) Volcano plot evidencing the differentially expressed genes (purple dots) found when FCD organoids and controls organoids were compared. (K) Box plot evidencing the differential expression of MMP2 when comparing patients and controls; P = 0.00476 and a fold change of −4.45. J and K were obtained from the ROSALIND™ platform. (L) Quantification and western blotting of MMP2 from 90-day-old organoids; four independent batches of organoids per subject (n = 12 control and n = 11 patients). Each subject comprised two different clones of iPSCs. The expression levels were normalized to β-tubulin III; P = 0.0489. The results are presented as the mean ± SEM. A one-sample t-test was used to assess statistical significance; *P < 0.05, **P < 0.001, ****P < 0.0001. Controls: WT83 clone 1◑, clone 2◐; 4C clone 1◨, clone 2 ◧; 969 clone 1◮, clone 2 ◭, 121 clone 1 ◆ clone 2 ◇; patients: F1 clone 1●, clone 2 ○; F2 clone 1■, clone 2 □, F3 clone 1▲, clone 2 △, F4 clone 1▼, clone 2▽.

