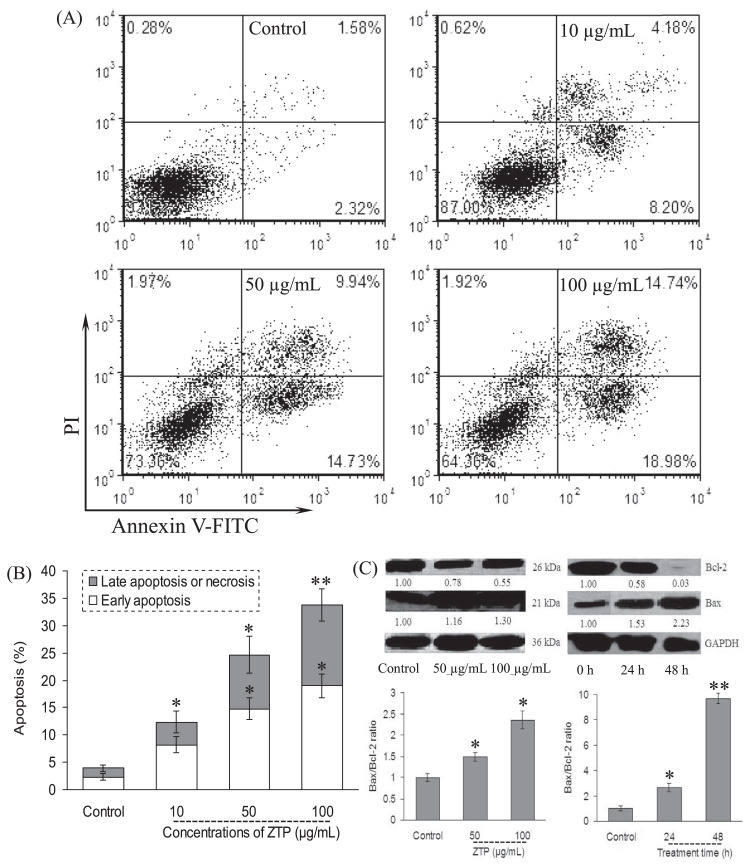
Figure 3.
ZTP induced apoptosis through the initiation of the mitochondrial pathway. MCF-7 cells were treated with ZTP at 10 μg/mL, 50 μg/mL, and 100 μg/mL for 48 hours, and after harvesting, MCF-7 cells were double stained with annexin V-FITC and PI, and then 10,000 cells were analyzed by flow cytometry. (A) Representative dot plots of annexin V/PI staining. (B) Column bar graph of apoptotic cells. (C) After MCF-7 cells were further treated with ZTP at 50 μg/mL and 100 μg/mL for 48 hours, and at 100 μg/mL for 24 hours and 48 hours, the expression levels of Bcl-2 family protein and the corresponding ratio of Bax/Bcl-2 are assayed, respectively. Western blot analysis was performed in triplicate per experimental point, and the relative expression of protein was quantified densitometrically; GAPDH was used as a reference control. The number under each band in the immunoblot indicates the relative intensity of the corresponding band. * p < 0.05, as compared with the control cells. ** p < 0.01, as compared with the control cells. PI = propidium iodide.

