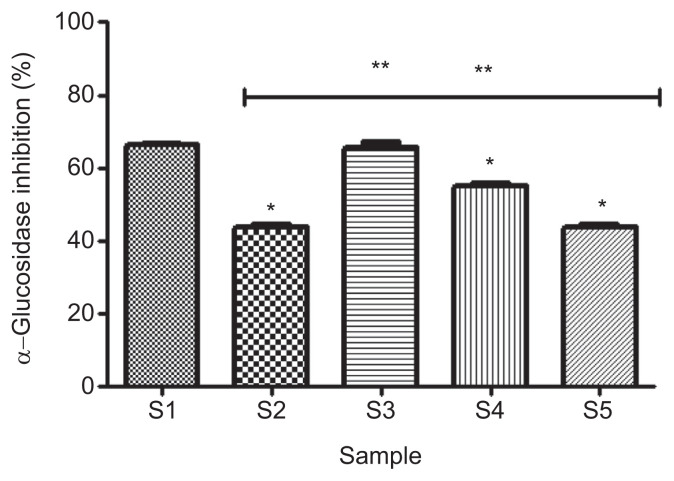
Figure 2.
Effect of gallic acid on α-glucosidase inhibitory ability of acarbose (in vitro). Bars represent mean ± standard deviation of triplicate readings (n =3). * Mean values are significantly different (p < 0.05) compared with S1. ** Mean values are significantly different (p < 0.05) compared with S2. S1 =100% acarbose (25μM); S2 =100% gallic acid (25μM); S3 =50% acarbose +50% gallic acid; S4 =75% acarbose +25% gallic acid; S5 =25% acarbose +75% gallic acid.

