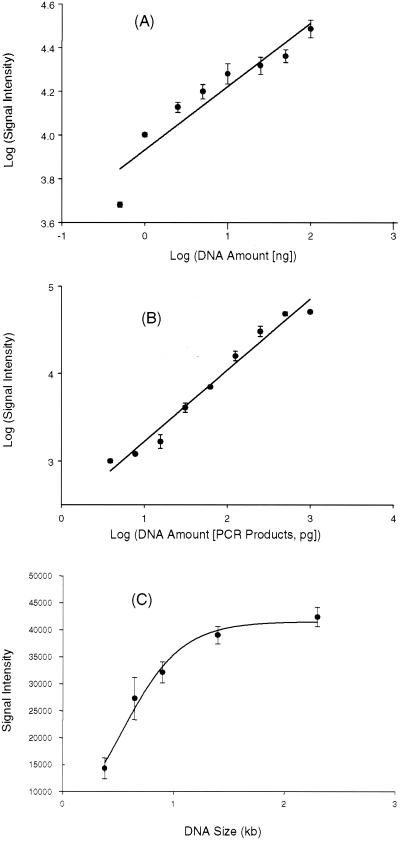
FIG. 3.
Quantitative analysis of functional gene arrays. (A) Relationship of hybridization signal intensity to DNA target concentration from a single pure culture. Genomic DNA from nirS-containing P. stutzeri E4-2 was labeled with Cy5 and hybridized to the microarrays at the following target concentrations: 0.5, 1, 2.5, 5, 10, 25, 50, and 100 ng. The plot shows the log-transformed average hybridization intensity versus the log-transformed target DNA concentration. (B) Relationship of hybridization signal intensity to DNA target concentration using a mixture of target DNAs. The PCR products from the following nine strains were mixed together in different quantities (in picograms): E4-2 (nirS), 1,000; G179 (nirK), 500; wc301–37 (amoA), 250; ps-47 (amoA), 125; pB49 (nirS), 62.5; Y32K (nirK), 31.3; wA15 (nirS), 15.6; ps-80 (amoA), 7.8; wB54 (nirK), 3.9. All of these genes are less than 80% identical. The mixed templates were labeled with Cy5. The plot shows the log-transformed average hybridization intensity versus the log-transformed target DNA concentration for each strain. (C) Effects of probe DNA size and composition on hybridization signal intensity. Microarrays contained DNA fragments (200 ng μl−1) of different sizes amplified from different regions in the S. oneidensis MR-1 genome. The target DNA was prepared by labeling MR-1 genomic DNA with Cy5 using the Klenow fragment with random hexamer primers. For panels A and B, the data points are mean values derived from three independent microarray slides, with three replicates on each slide (a total of nine data points). Error bars showing the standard deviations are presented.

