
Fig. 1.
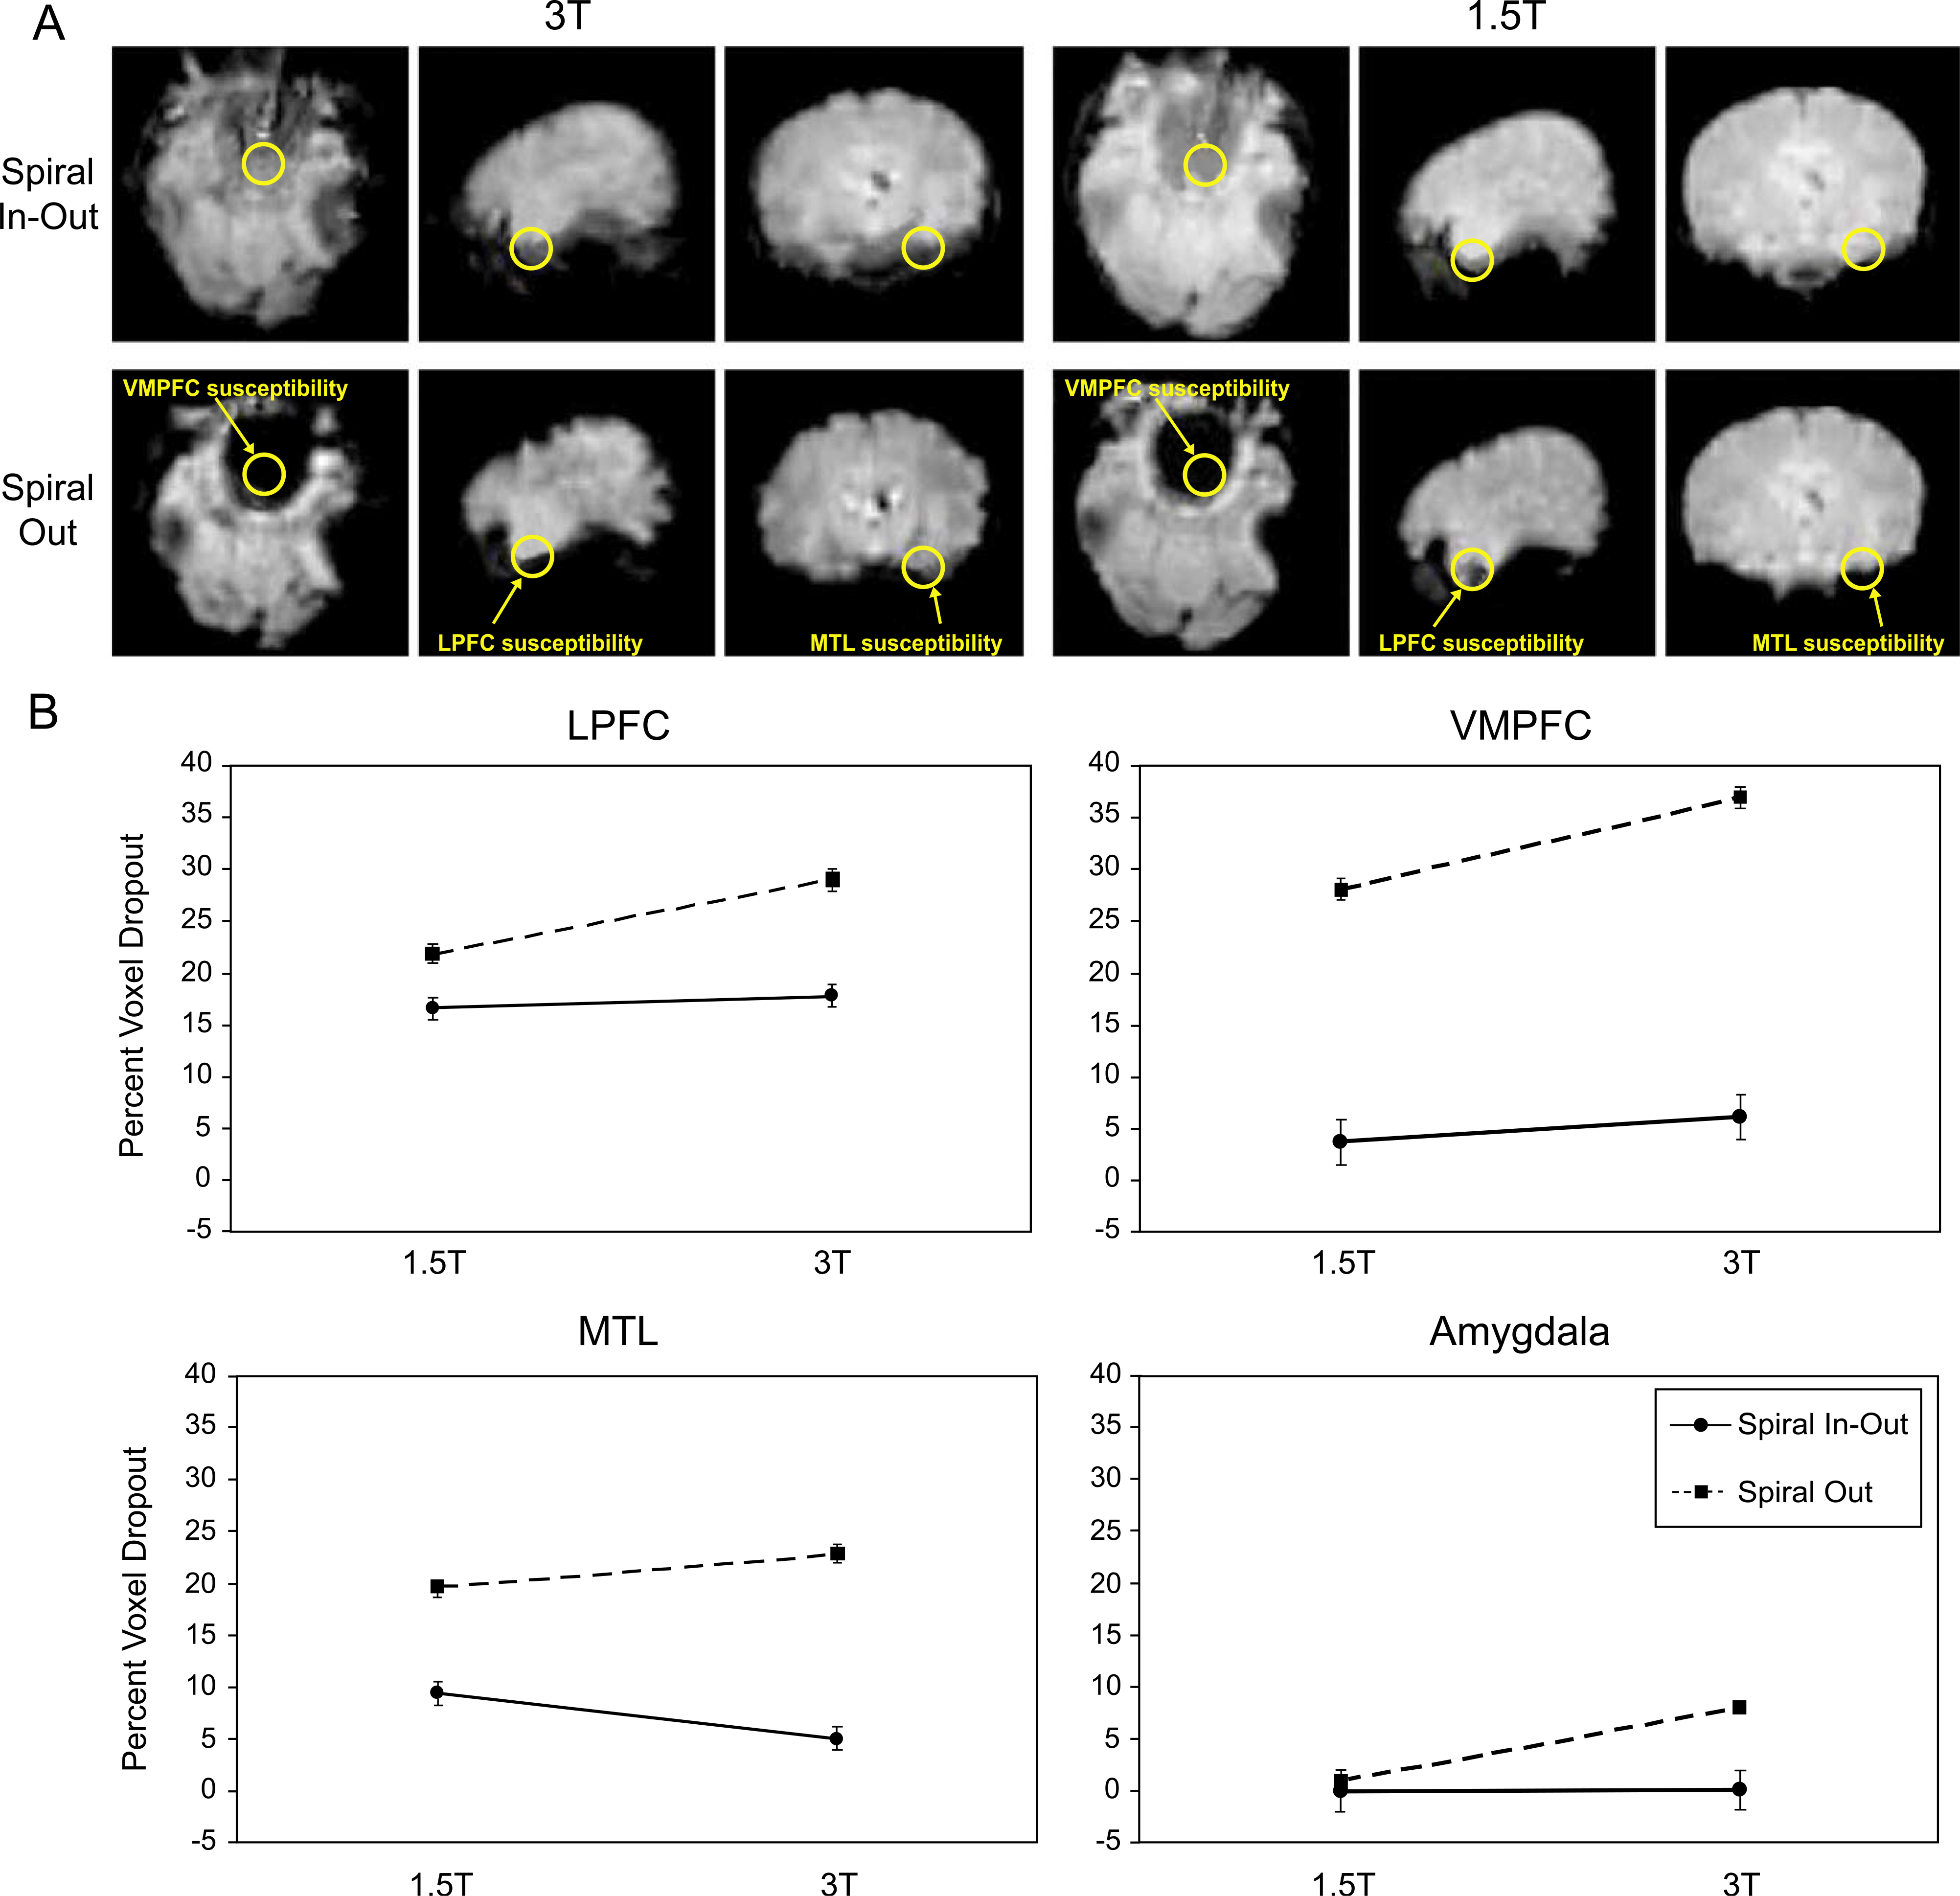
(A) Example of the comparison of T2* weighted images from one subject, showing ROIs used for the dropout analysis in regions associated with the tasks performed. ROIs for amygdala are similar in location to those for MTL but are more anterior and not shown for clarity. (B) Signal dropout for each ROI averaged over all subjects. Dropout is greater in all regions at 3 vs. 1.5 T for the spiral-out sequence. Dropout for the spiral-io sequence is significantly reduced vs. spiral-out at 3 T and is either the same or significantly reduced (in MTL) at 1.5 T.