
Fig. 2.
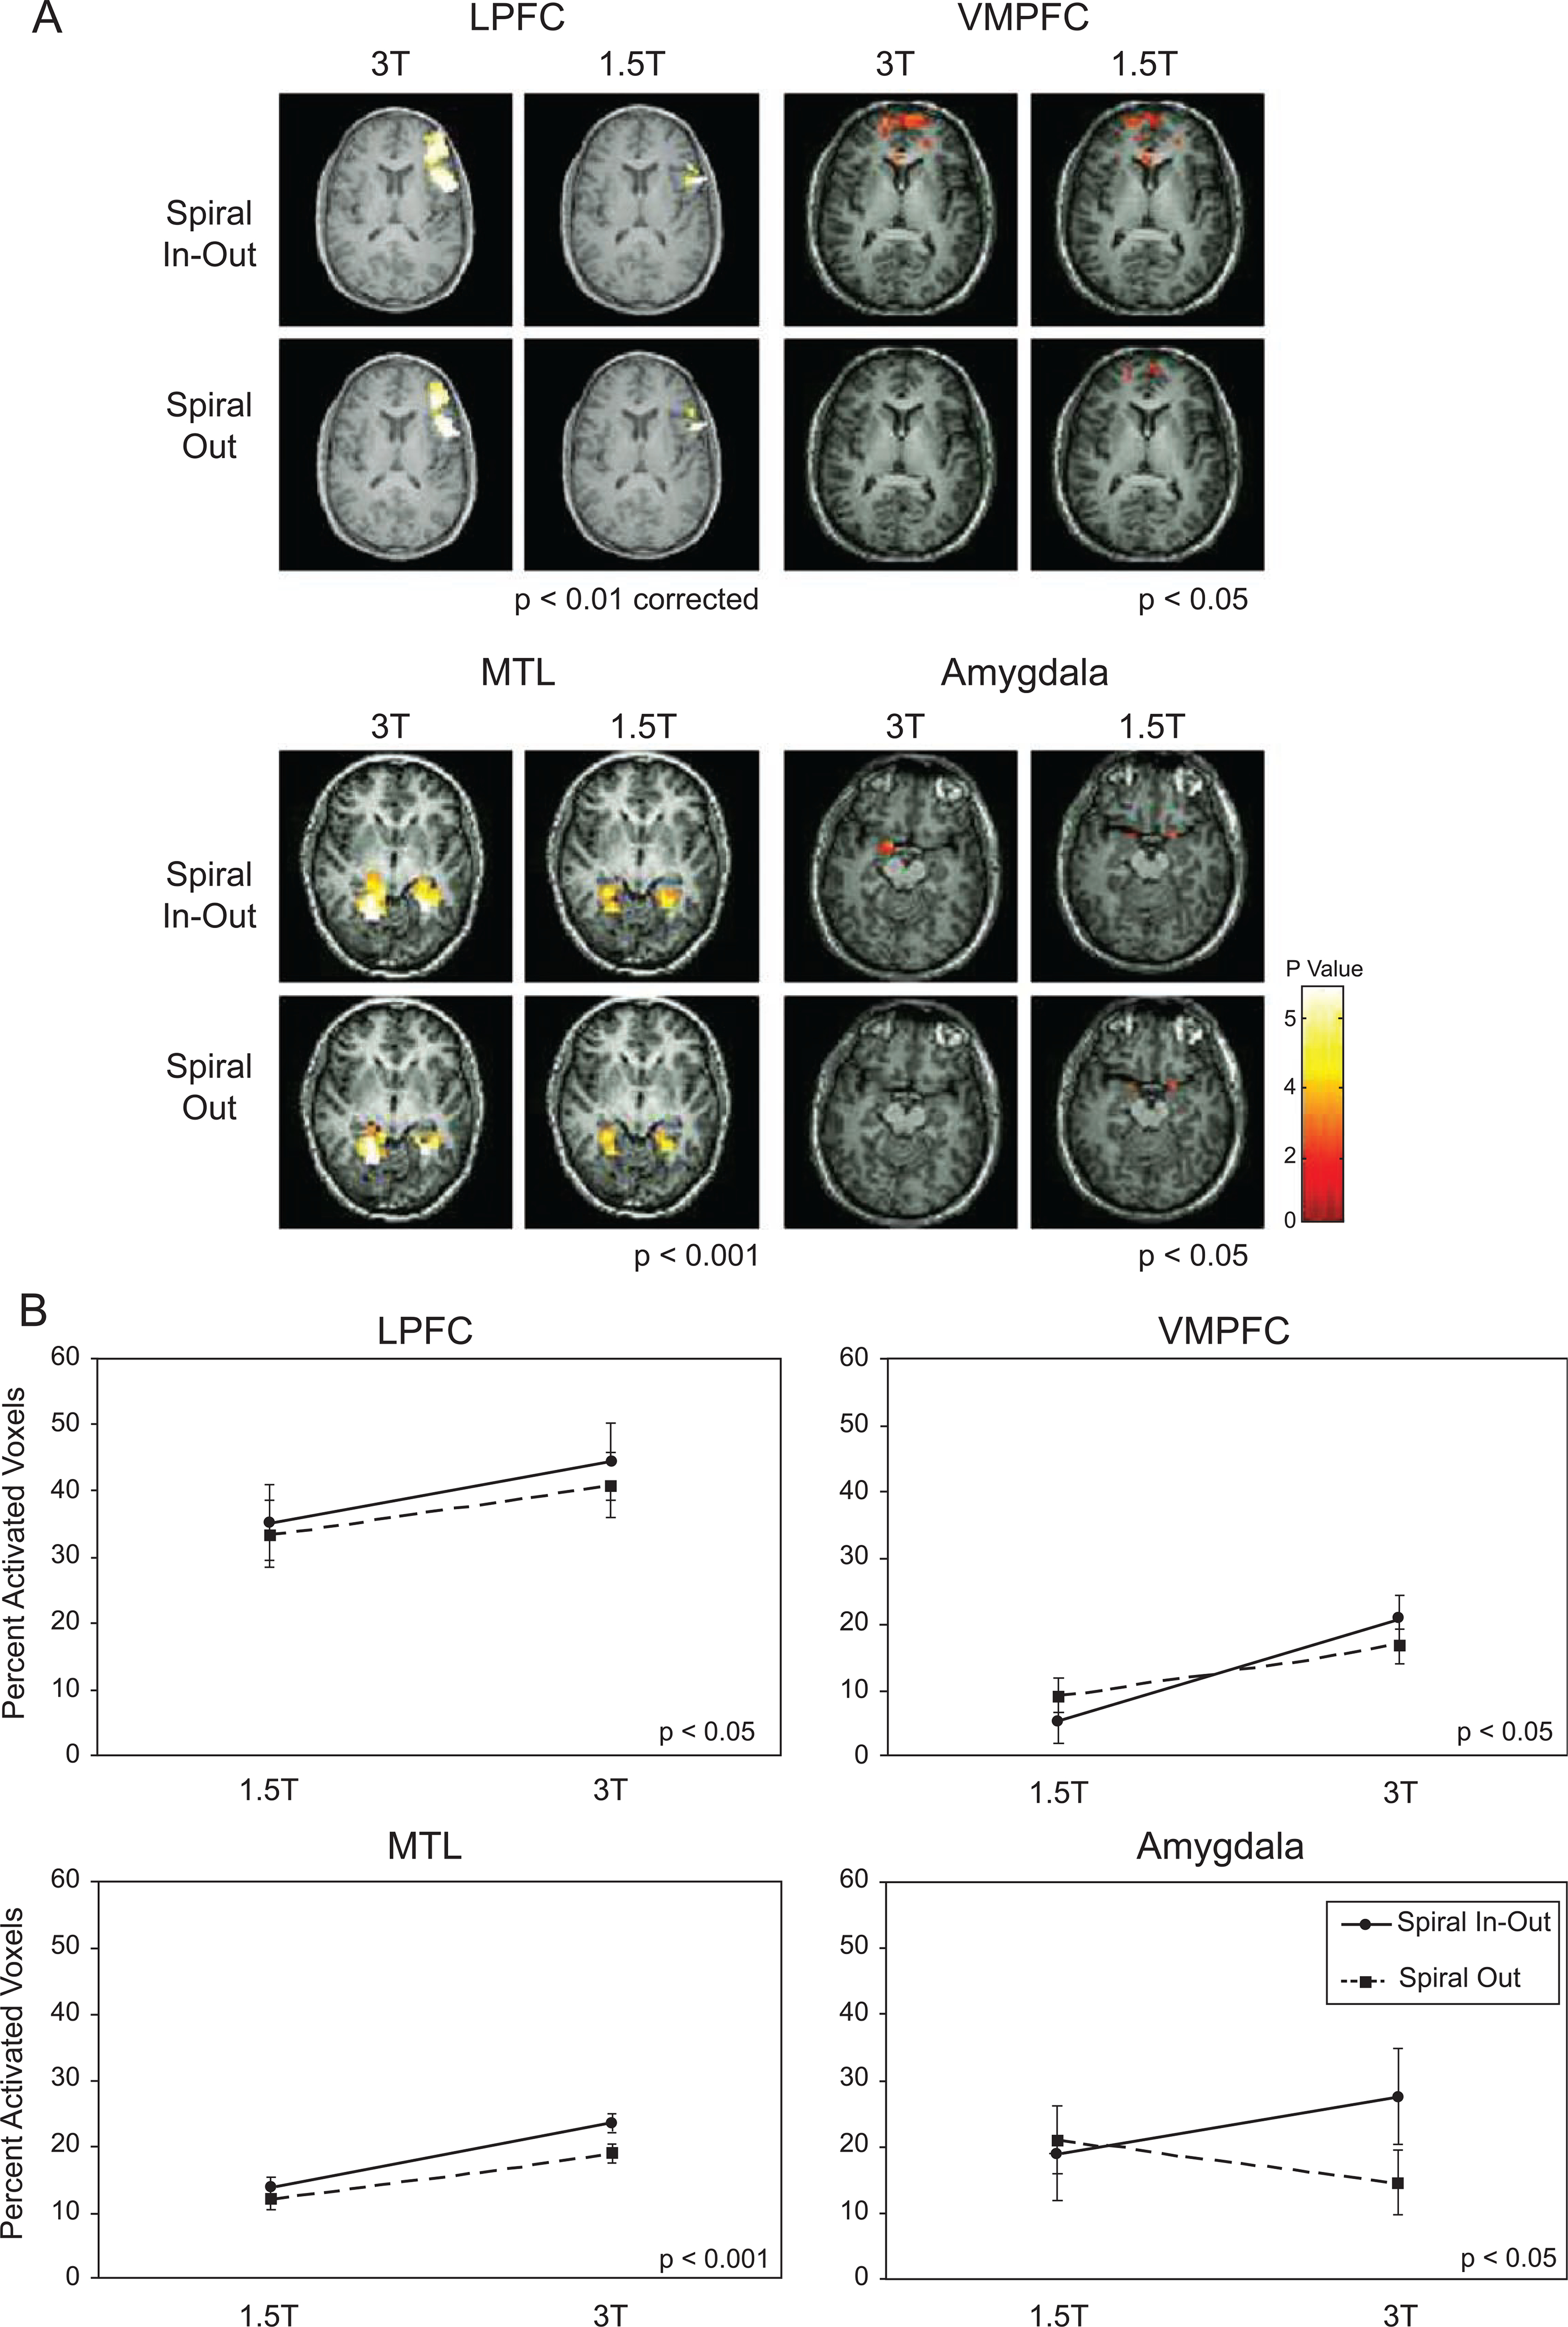
(A) Example of single-subject activation maps. Activation seen in amygdala at 1.5 T is lost at 3 T with spiral-out, but is recovered and greater at 3 T with spiral-io. (B) Activation volumes as a percentage of ROI volume, showing nonsignificant differences for sequence type at 1.5 T, increased activation extent for all regions with spiral-io at 3 T over 1.5 T and less gains (loss in amygdala) with spiral-out. For all subjects, the spiral-io sequence more than mitigated the activation volume loss in amygdala with the conventional spiral sequence at 3 T. The film task was used for the VMPFC and amygdala maps and plots.