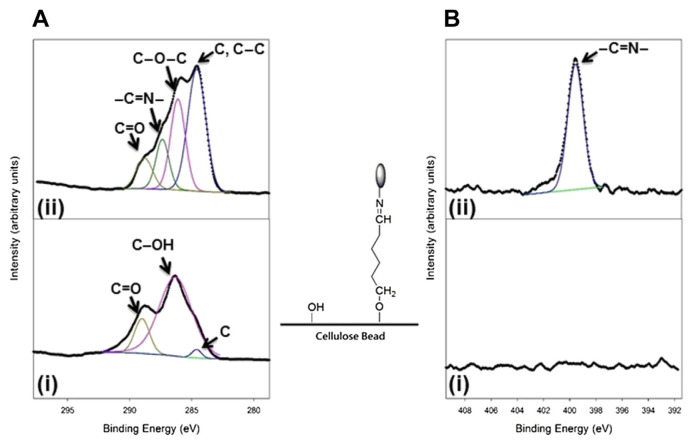
Figure 1.
The observed (A) C 1s and (B) N 1s electron spectroscopy for chemical analysis (ESCA) spectra used for examining enzyme immobilization: (i) clean cellulose beads and (ii) cellulose beads with enzyme immobilization. The characteristic functional groups responsible for the corresponding ESCA signals are indicated by arrows. The atomic compositions of cellulose beads without and with enzyme immobilization were determined as follows: (a) clean cellulose beads: C, 66.16 ± 0.1; O, 33.83 ± 0.1 and (b) cellulose beads with enzyme immobilization: C, 60.06 ± 0.2; O, 35.49 ± 0.1; N, 4.47 ± 0.1.

