Abstract
Caffeine reference material certified for purity is produced worldwide, but no research work on the details of the certification process has been published in the literature. In this paper, we report the scientific details of the preparation and certification of pure caffeine reference materials. Caffeine was prepared by extraction from roasted and ground coffee by dichloromethane after heating in deionized water mixed with magnesium oxide. The extract was purified, dried, and bottled in dark glass vials. Stratified random selection was applied to select a number of vials for homogeneity and stability studies, which revealed that the prepared reference material is homogeneous and sufficiently stable. Quantification of caffeine purity % was carried out using a calibrated UV/visible spectrophotometer and a calibrated high-performance liquid chromatography with diode-array detection method. The results obtained from both methods were combined to drive the certified value and its associated uncertainty. The certified value of the reference material purity was found to be 99.86% and its associated uncertainty was ±0.65%, which makes the candidate reference material a very useful calibrant in food and drug chemical analysis.
Keywords: caffeine, certification, coffee, extraction, purity analysis
1. Introduction
Caffeine (1,3,7 trimethyl xanthine) is a natural component of tea, coffee, guarana, and cocoa. It is also present in chocolate, cola beverage, and soft drinks [1]. The caffeine content of raw Arabica coffee is 0.9–1.4%, while in Robusta coffee it varies from 1.5% to 2.6%. Caffeine obtained by the decaffeination process and synthetic caffeine are used by the pharmaceutical and soft drink industries [2]. Caffeine has numerous physiological effects, such as stimulation of the central nervous system, and enhancement of blood circulation and respiration [2]. Analytical measurement of the caffeine content is, therefore, of fundamental importance for nutritional and pharmaceutical applications. The accuracy and credibility of the data produced by measurements depend largely on the traceability of the measurement results to the international system of units. In chemical analysis, certified reference materials (CRMs) are the measurement standards by which metrological traceability can be achieved. It is reported that reference materials (RMs) are generally desired for determining compliance with the existing regulations and for determining the systematic errors when developing a new analytical method. RMs are widely used for calibration of equipment, and for quality control and quality assurance programs in many fields. Caffeine CRM is produced by some national metrology institutes such as the National Metrology Institute of Australia and by some companies such as Sigma, Alfa Aesar, and others. However, no published research work on the certification process of pure caffeine RM is available in the literature, and only CRM certificates issued by the producers can be obtained. There are very few reports in the literature on the certification of caffeine in some food matrixes. Sander et al [3] certified three green tea RMs characterized for catechins, xanthine alkaloids, theanine, and toxic elements using five analytical methods. Thomas et al [4] developed a rapid and selective isocratic reversed-phase liquid chromatographic method to measure caffeine, theobromine, and theophylline simultaneously in baking chocolate. In addition, Thomas et al [5] determined the concentration of caffeine and caffeine-related compounds in two ephedra-containing RMs by three independent analytical methods. Sharpless et al [6] collaborated to produce a series of CRMs for dietary supplements. In this series, values were assigned for ephedrine alkaloids and toxic elements in all certified materials and for other analytes (e.g., caffeine, nutrient elements, proximates, etc.) in some of the RMs. In this study, we report for the first time, a full scientific process of the extraction, purification, and certification of caffeine RM. In this work, high-performance liquid chromatography with diode-array detection (HPLC-DAD) and UV/visible (Vis) spectrophotometry was used as two independent analytical methods; data from these methods was combined to produce the certified value and uncertainty.
2. Experimental
2.1. Materials and reagents
Roasted and ground coffee was purchased from the local market in Cairo, Egypt. Magnesium oxide (reagent grade), hexane, dichloromethane, and acetonitrile (HPLC grade) were purchased from Merck, Darmstadt, Germany. Caffeine calibrant(99.7%)was obtained from Alfa Aesar, Karlsruhe, Germany.
2.2. Extraction of caffeine from roasted and ground coffee
Fats were removed from the coffee sample via three successive extractions by hexane for 24 hours. After that, 10 g of defatted coffee was added to 50 g of magnesium oxide in a 1 L measuring flask, and 800 mL deionized water was added [7]. The flask was heated at 90°C under stirring for 20 minutes and then left to cool to room temperature, and the volume was made up to 1 L. After settling of the solids, the solution was filtered and the filtrate was extracted with dichloromethane [8]. The solvent was evaporated and caffeine powder was obtained. An amount of 600 g of coffee was extracted by this method, and a total yield of 6 g was obtained. The extracted caffeine was then purified on a chromatographic column (1 cm i.d. × 24 cm) packed with 4.2 g silica gel. Acetonitrile (10 mL) was pooled and drained into the column to ensure column conditioning; 6 mg of the extracted caffeine in 10 mL of acetonitrile/water mixture (95:5%) was poured into the column. Thus, the whole amount of extracted caffeine was purified.
2.3. Equipment
The purity measurement was carried out using the UV/Vis spectrophotometer Analytikjenaspecord 250 Plus equipped with a 15-sample tray. Measurements were made using a quartz cell at 273 nm. A reversed-phase liquid chromatography, Agilent 1100 series system, equipped with a G1379A vacuum degasser, a G3111A quaternary pump, a G1313A autosampler, a G1315B diode-array detector, and a G1364C fraction collector, was used. Chromatographic separation of caffeine and other compounds was achieved by a Zorbax-Eclipse-XDB-C18 column (4.6 mm × 250 mm, 5 μm).
2.4. Calibration
For calibration of the HPLC-DAD method, a stock solution was prepared by weighing 0.10011 g of caffeine and dissolving it in 0.1 L ultrapure water. From the prepared stock solution, 10 calibration solutions of concentrations 10 mg/L, 20 mg/L, 30 mg/L, 40 mg/L, 50 mg/L, 60 mg/L, 70 mg/L, 80 mg/L, 90 mg/L, and 100 mg/L were prepared and injected into the HPLC system. Meanwhile, a stock solution for calibration of the UV/Vis spectrophotometer was prepared by weighing 0.10037 g of the same caffeine and dissolving it in 0.1N HCl [9]. Six calibration solutions of concentrations 10 mg/L, 20 mg/L, 30 mg/L, 40 mg/ L, 50 mg/L, and 60 mg/L were prepared from the stock solution and were measured by the UV/Vis spectrophotometer. Detection was done by a photodiode array detector at 273 nm wavelength.
2.5. Homogeneity study
Five sealed vials, including the first and the last ones, were randomly selected for the homogeneity study. The between-and the within-vial variability were studied by dividing each of the selected vials into three subsamples. Measurements were performed by Method 1 (M1).
2.6. Assay of caffeine purity
The purity of caffeine was measured by two methods. In M1, reversed-phase liquid chromatography with a Zorbax-Eclipse-XDB-C18 column (4.6 mm × 150 mm, 5 μm) was used. Solvent A of the mobile phase was acetonitrile and Solvent B was deionized water. The flow rate was 0.9 mL/min and the injection volume was 5 μL. Detection was done by a photodiode array detector at 273 nm wavelength. In Method 2 (M2), a UV/ Vis spectrophotometer was used and the measured caffeine samples were diluted 10 times to be measured on the linear calibration curve in the concentration range of 10–60 mg/L. Uncertainty of sample dilution was added to the uncertainty sources of the method.
2.7. Stability study
The stability study was performed at four time points, 0 months, 2 months, 4 months, and 6 months, and at 4°C and 20°C using M1.
3. Results and discussion
Extraction of caffeine from roasted coffee, purification, and quantification to prepare pure substance RM have been the backbone of this research work. The experimental methods of analysis and traceability of the measurement results to the international system of units, in addition to the homogeneity and stability studies of the prepared RMs, were discussed. Statistical analysis of the data obtained from each method was carried out to drive the certified value and its associated uncertainty. Assignment of the certified value was based on the approach of combining data from two independent and reliable analytical methods developed by The National Institute of Standards and Technology (NIST). This approach is widely used in certification of the chemical composition of RMs [10–12].
3.1. Pure substance RM (caffeine)
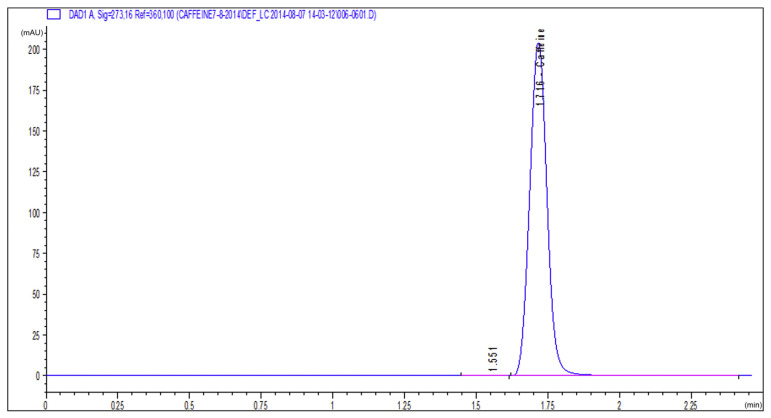
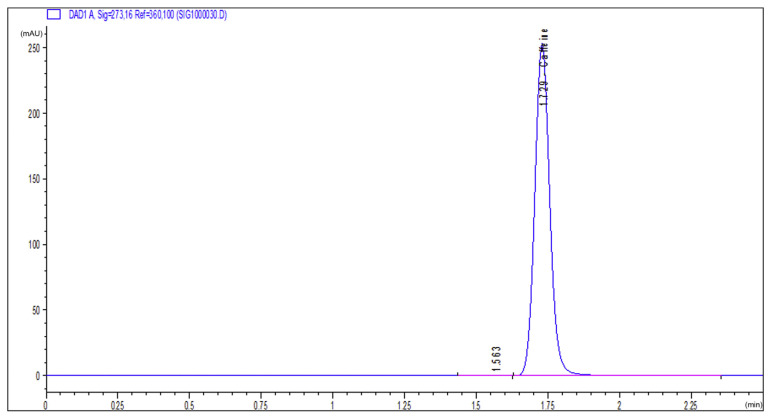
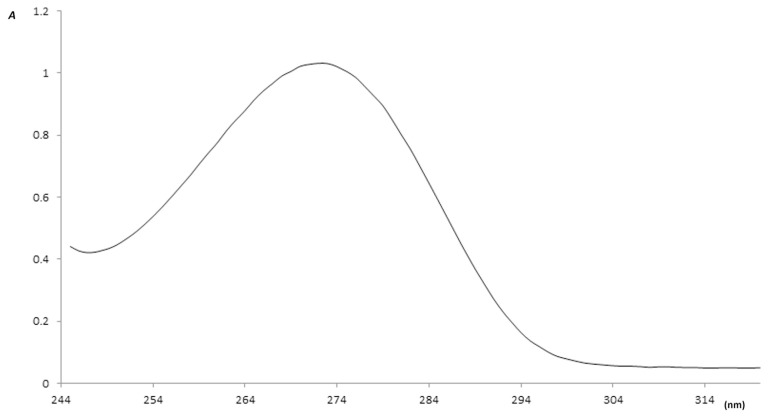
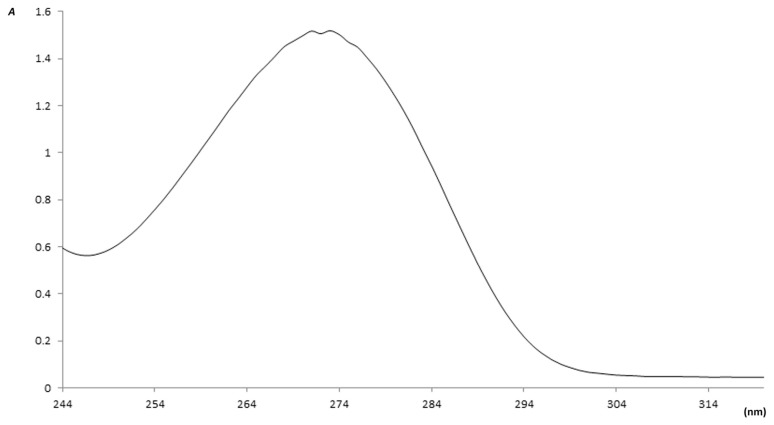
In order to ensure extraction of caffeine from roasted coffee, a sample of the standard caffeine purchased from Alfa Aesar and a sample of the extracted caffeine were run on the HPLC system and the UV/Vis spectrophotometer under the same conditions. The produced HPLC chromatograms of both samples are shown in Figures 1 and 2, and the absorbance peaks produced by the spectrophotometer are shown in Figures 3 and 4. From Figures 1 and 2, it is clear that the peaks of the two samples appear at the same retention time (1.75 minutes), and from Figures 3 and 4 we can also see that the two absorption peaks appear at 273 ± 1 nm. This clearly assures the extraction of caffeine from roasted coffee. The extract was then purified on a silica gel column and dried. The whole purified caffeine RM was bottled in 25 vials, each containing 0.2 g. Stratified random selection was applied to select five vials for homogeneity study and for certification of the caffeine purity %.
Figure 1.
HPLC chromatogram of the standard caffeine sample. HPLC =high-performance liquid chromatography.
Figure 2.
HPLC chromatogram of the extracted caffeine sample. HPLC =high-performance liquid chromatography.
Figure 3.
The UV/Vis absorbance curve of the standard caffeine. Vis = visible.
Figure 4.
The UV/Vis absorbance curve of the extracted caffeine. Vis = visible.
3.2. Traceability of measurements
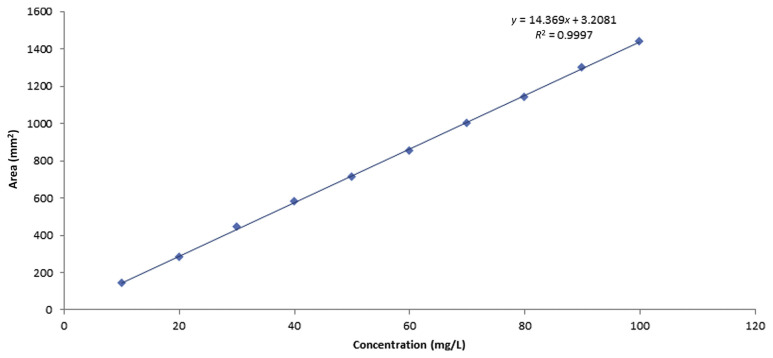
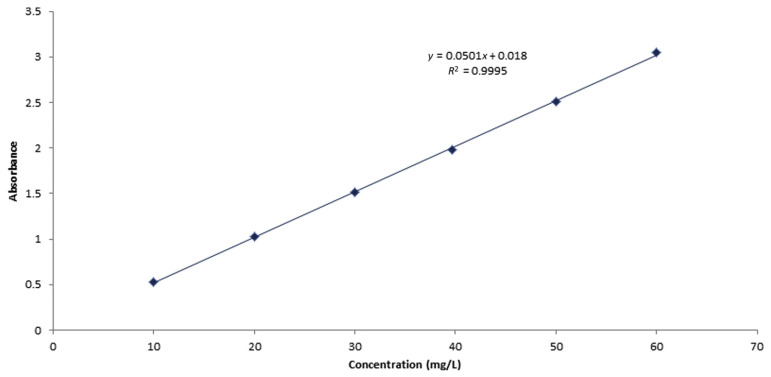
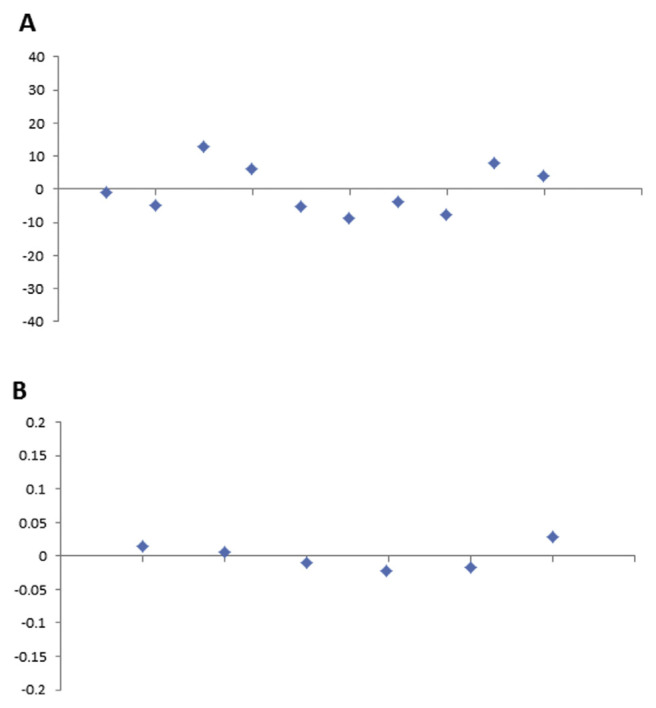
Metrological traceability is defined as the property of a measurement result whereby the result can be related to a reference through a documented unbroken chain of calibrations, each contributing to the measurement uncertainty. In the present work, traceability of the measurement results was based on the purity of caffeine provided by Alfa Aesar, which we have assessed by HPLC and the UV/Vis spectrophotometer. It also depends on traceable mass and volume measurements, and appropriate uncertainties. By contrast, calibration is defined as an operation that, under specified conditions, in the first step, establishes a relation between the quantity values with measurement uncertainties provided by measurement standards and corresponding indications with associated measurement uncertainties, and in the second step, uses this information to establish a relation for obtaining a measurement result from an indication. For calibration of the HPLC-DAD method, a stock solution was prepared by weighing 0.10011 g of caffeine (99.7%) and dissolving in it 0.1 L ultrapure water. From the stock solution, 10 diluted calibration solutions in the concentration range 9.981–99.806 mg/L were prepared and injected into the HPLC system. Meanwhile, a stock solution for calibration of the UV/ Vis spectrophotometer was prepared by weighing 0.10037 g of the same caffeine and dissolving it in 0.1 L of 0.1N HCl [9]. Six diluted calibration solutions in the concentration range of 10–60 mg/L were prepared from the stock solution and measured by the UV/Vis spectrophotometer. The obtained calibration curves of the two instruments are shown in Figures 5 and 6, respectively. Linearity of the calibration curves for each method was checked by calculation of the residuals and plotting them as shown in Figures 7A and 7B. It can be seen that the residuals of all calibration curves are randomly distributed on both sides of the zero axis, which confirms the linearity of the curves [13]. This also ensures that measurement results traceable to the international system of units can be obtained.
Figure 5.
Calibration curve of the HPLC-DAD by standard caffeine solutions. HPLC-DAD =high-performance liquid chromatography with photodiode array detection.
Figure 6.
Calibration curve of the UV/Vis spectrophotometer by standard caffeine solutions. Vis = visible.
Figure 7.
Residual errors of the calibration curves of (A) HPLC-DAD and (B) the UV/Vis spectrophotometer. HPLC-DAD =high-performance liquid chromatography with photodiode array detection: Vis = visible.
Linearity was also tested by the F test. It has been found that values of Fcalculated (26,890 and 8777, respectively) for M1 and M2 were larger than those of Ftabulated (2.14 × 10⁻¹⁵ and 7.78 × 10⁻⁸, respectively), which assures that all calibration curves were linear in the specified ranges mentioned above.
3.3. Caffeine RM purity assignment
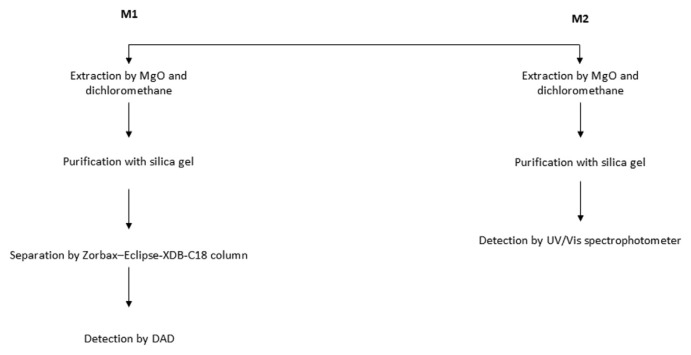
Measurement of the caffeine RM purity % was carried out by two different analytical techniques, as illustrated in Figure 8. The first was HPLC (M1) with a Zorbax-Eclipse-XDB-C18 column using diode array detection. Caffeine (0.01 g) from each of the randomly selected RM vials was dissolved in ultrapure water, and 1 mL of that diluted solution was injected into the HPLC system. Measurements for each vial were performed under the same repeatability conditions. The mean of each set of measurements was calculated, which is given in Table 1. The second technique was UV/Vis spectrophotometry (M2), where sample was prepared by dissolving 0.0183 g sample of each of the selected five vials in 50 mL of 0.1N HCl. The same protocol of measurements carried out by HPLC was followed using the UV/Vis spectrophotometer.
Figure 8.
The two independent methods of analysis of caffeine RM purity %. DAD =photodiode array detection; M1 =method 1; M2 =method 2; RM =reference material; Vis = visible.
Table 1.
Measurement results of caffeine RM purity %.
| Analyte | HPLC-DAD (M1) | UV/Vis spectrophotometer (M2) |
|---|---|---|
| Caffeine | 99.905 | 99.860 |
| 99.909 | 99.790 | |
| 99.940 | 99.905 | |
| 99.854 | 99.810 | |
| 99.899 | 99.928 | |
| 99.901 | 99.714 | |
| 99.872 | 99.827 | |
| 99.902 | 99.812 | |
| 99.971 | 99.887 | |
| 99.920 | 99.886 | |
| 99.900 | 99.730 | |
| 99.868 | 99.842 | |
| 99.961 | 99.800 | |
| 99.914 | 99.877 | |
| 99.904 | 99.764 | |
| 99.866 | 99.915 | |
| 99.970 | 99.753 | |
| 99.857 | 99.755 | |
| 99.882 | 99.908 | |
| 99.869 | 99.880 | |
| Mean | 99.903 | 99.832 |
| SD | ±0.036 | ±0.066 |
HPLC-DAD = high-performance liquid chromatography coupled with diode array detection; M1 = Method 1; M2 = Method 2; RM = reference material; SD = standard deviation; Vis = visible.
The means of the sets of measurement results were calculated, which are given in Table 1. From the results, it can be seen that the extracted caffeine is of very high purity (more than 99.8%) and the results obtained from both methods are in very good agreement, where the difference between the two grand means was only 0.1%. Moreover, the equality of the two method means was examined by the Aspin–Welch test [14–19]. It was found that Tcalculated (0.00007) was less than tcritical (1.686), which indicates that the two means are nearly equal. However, the standard deviation of the mean of M1 (0.036) was about one-half of that of M2 (0.066). This means that the repeatability of the measurement results obtained by HPLC was better than that obtained by the UV/Vis spectrophotometer.
3.4. Statistical treatment of measurement results
In quantitative measurements, the result cannot be reproduced with absolute reliability because, by reason of inevitable deviations, measured results vary within certain intervals and observations. The reliability of analytical tests depends on the sample and the analytical method applied, and it can be ensured by testing the results for normality, outliers, and equality of means.
3.4.1. Normality (Kolmogorov–Smirnov test)
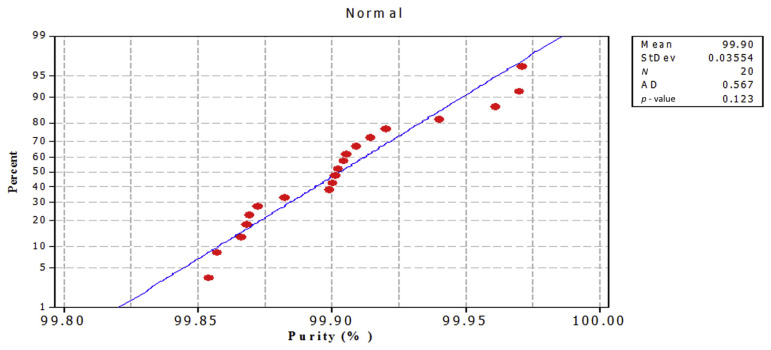
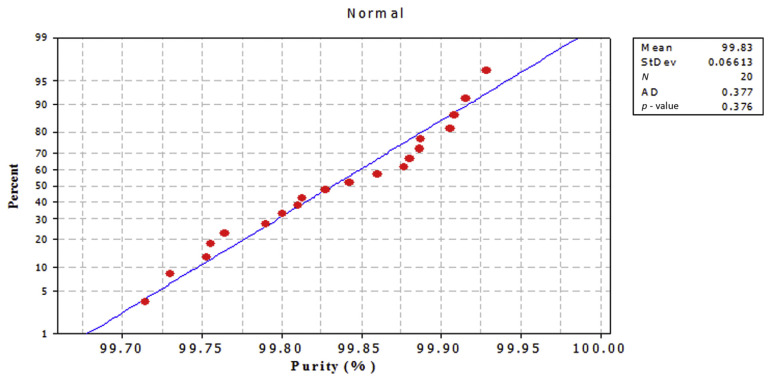
The purpose of this test is to recognize deviations from the normal distribution in the case of small sample sizes. The hypothesis H to be tested is that the sample has been taken from a normally distributed population against the alternative hypothesis that the sample has not been taken from a normally distributed population. If the hypothesis is true, it can be expected that the two cumulative distribution functions, i.e., the cumulative distribution function of the normal distribution and that of the sample, will be very similar; any difference between them tends to indicate that the hypothesis of goodness of fit might not be reasonable. The data were plotted against a theoretical normal distribution in such a way that the points should form an approximate straight line, as shown in Figures 9 and 10. Departures from this straight line indicate departures from normality. The points on those plots form a nearly linear pattern, which indicates that the normal distribution is a good model for data from both methods. At the level of significance α = 0.05, the decision is not to reject the null hypothesis of no difference between empirical and theoretical cumulative distributions. In other words, the difference between empirical and theoretical cumulative distributions is not significant. Data analysis was performed using the Kolmogorov–Smirnov test (statistical package Minitab 16). A p value < 0.05 indicates a statistically significant difference.
Figure 9.
Normal probability plot for caffeine RM purity % by Method 1. RM =reference material; StDev =standard deviation.
Figure 10.
Normal probability plot for caffeine RM purity % by Method 2. RM =reference material: StDev =standard deviation.
3.4.2. Grubbs’ tests for outliers
Grubbs’ test is used to detect outliers in a univariate data set. It is based on the assumption of normality [20,21]. The data were verified to be normally distributed before applying the Grubbs’ test. Costat statistical software was used for outlier detection. From significance level α = 0.05 (p value) no outliers were detected in the data from both methods, as shown in Table 2.
Table 2.
Grubbs’ tests results for outliers of caffeine data.
| Analyte | p | Outliers | ||
|---|---|---|---|---|
|
|
|
|||
| M1 | M2 | M1 | M2 | |
| Caffeine | 0.435 | 0.363 | No outlier | No outlier |
M1 = Method 1; M2 = Method 2.
3.5. Caffeine RM homogeneity
Homogeneity of the prepared caffeine RM was assessed by studying the between- and the within-vial variability [22–29]. Each of the randomly selected five vials was divided into three subsamples, each of which was measured three times by HPLC under repeatability conditions against the same calibration curve. The means of the measurement results were calculated, which are given in Table 3. The results were analyzed by analysis of variance (ANOVA) to estimate the uncertainty of the material variability and judge the material homogeneity. ANOVA results are given in Table 4, from which it can be seen that Fcalculated is smaller than Fcritical, which means that the RM is homogeneous. The uncertainty of the material homogeneity σh was calculated according to Eq. (1) and was found to be 0.0133, as reported in Table 3:
Table 3.
Purity %, results of the caffeine reference material homogeneity testing.
| Between vials | V1 | V2 | V3 | V4 | V5 | σ h |
|---|---|---|---|---|---|---|
| Within vials | 99.900 | 99.899 | 99.971 | 99.961 | 99.970 | 0.0133 |
| 99.854 | 99.902 | 99.868 | 99.866 | 99.869 | ||
| 99.909 | 99.901 | 99.920 | 99.914 | 99.857 | ||
| 99.940 | 99.872 | 99.900 | 99.904 | 99.882 | ||
| 99.901 | 99.893 | 99.915 | 99.911 | 99.894 |
Table 4.
ANOVA for homogeneity testing.
| Source of variation | SS | Df | MS | Fcalculated | p | Fcritical |
|---|---|---|---|---|---|---|
| Between vials | 0.002 | 4 | 0.0005 | 0.421 | 0.791 | 2.866 |
| Within vials | 0.022 | 20 | 0.001 | |||
| Total | 0.024 | 24 |
ANOVA = analysis of variance; Df = degree of freedom; MS = Mean Square; SS = total sum of squares.
| (1) |
3.6. Stability of the caffeine RM
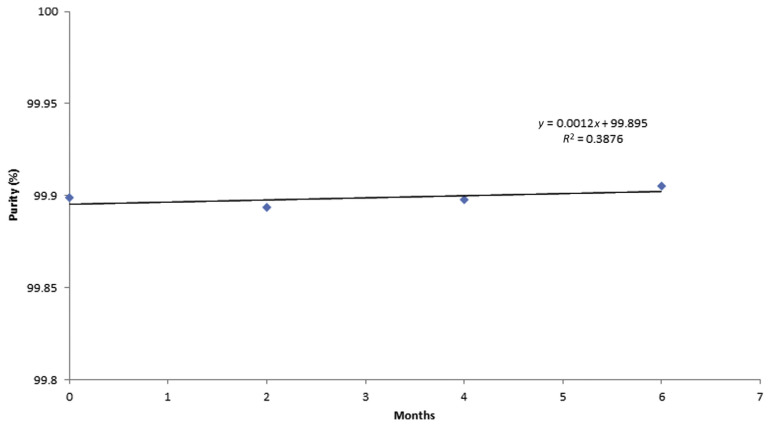
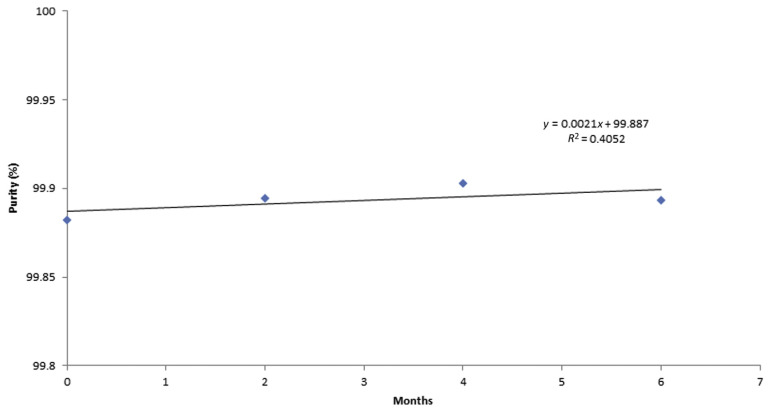
To assess the stability of the caffeine RM, a sample was stored at 4°C and at 20°C, and then measured three times by HPLC at three time points (0 months, 2 months, and 6 months) at each temperature. The measurement results shown in Table 5 were plotted as a function of time and the regression lines were calculated to check for significant trends, possibly indicating degradation of the material, as shown in Figures 11 and 12.
Table 5.
Purity %, results of the caffeine reference material stability testing.
| Temperature | Time (0–6 mo) | |||||
|---|---|---|---|---|---|---|
|
| ||||||
| 0 mo | 2 mo | 4 mo | 6 mo | Slope | S | |
| 20°C | 99.882 | 99.894 | 99.903 | 99.893 | 0.002 | 0.002 |
| 4°C | 99.899 | 99.894 | 99.898 | 99.905 | 0.001 | 0.001 |
Figure 11.
Stability of caffeine CRM purity % for 6 months at 4°C. CRM =certified reference material.
Figure 12.
Stability of caffeine CRM purity % for 6 months at 20°C. CRM =certified reference material.
The uncertainty due to stability of the caffeine RM was calculated as uncertainty (S) of the slope of the regression line [23,25,27–30]. The significance of the slope was evaluated statistically with the aim of detecting any possible trend that would indicate degradation of the material. At storage temperatures 4°C and 20°C, statistically significant trends were not observed along the 6-month storage period where uncertainty S was 0.002% at 20°C and 0.001% at 4°C, which can be neglected when calculating the material variability. This clearly indicates that the prepared caffeine RM is stable.
3.7. Uncertainty of the measurement results
Uncertainty is defined as a non-negative parameter characterizing the dispersion of the quantity values being attributed to a measurand, based on the information used. Measurement uncertainty comprises Type A and Type B evaluations. In the present certification work, uncertainty of the calibration results of measuring instruments, methods of analysis, and uncertainty of the certified value were calculated.
3.7.1. Uncertainty of the calibration process
Uncertainty sources of the calibration of the HPLC-DAD method and the UV/Vis spectrophotometer are as follows: (1) purity of the caffeine provided by Alfa Aesar (0.0015%); (2) gravimetric dilution of caffeine; and (3) slope and intercept of the calibration curve. Uncertainty of the gravimetric dilution of caffeine includes uncertainty of the weighing balance, repeatability of measurements, and the volumetric pipette. Their combined values, uc, were found to be 0.005 for HPLC and 0.010 for the UV/Vis spectrophotometer. Uncertainty of the calibration curve was calculated according to Eq. (2) [21]:
| (2) |
| (3) |
where (yi – ŷ) is the residual error of the ith point and b is the calculated best fit gradient. The combined standard uncertainty uc of the calibration process was calculated according to Eq. (4), and was found to be 0.35 for HPLC-DAD and 0.34 for the UV/Vis spectrophotometer. These values are recorded in Table 6.
Table 6.
Uncertainty values of the calibration processes.
| Method | U calibration curve | U caffeine calibrant | U gravimetric dilution | u c |
|---|---|---|---|---|
| (M1) HPLC | 0.34742 | 0.0015 | 0.005 | 0.34746 |
| (M2) UV/Vis spectrophotometer | 0.34096 | 0.0015 | 0.010 | 0.34111 |
HPLC = high-performance liquid chromatography; M1 = Method 1; M2 = Method 2; Vis = visible.
| (4) |
3.7.2. Uncertainty of the mean of each method (repeatability of measurements)
Since more than one analytical method will be compared to determine the certified value, it is important that the variability of the mean for each method is estimated correctly. In order to estimate the standard uncertainty of the mean, ANOVA was used to determine which design factors have statistically significant effect on the measurements [14]. A two-way fully nested ANOVA model was used to perform data analysis, which reads as follows:
| (5) |
where yijk is the result of a single measurement in the experiment; μ is the expectation of yijk’, which is the value that yijk takes up when the number of repeated measurements tends to infinity. Ai is a bias term due to the (random) differences in the group, and Bij is a second bias term due to differences in the runs. The randomized complete block design model [14] explained in Eqs. (5–13) was used to calculate the Type A uncertainty of each of the method means:
| (6) |
Since the expectations for these three mean squares are as follows:
| (7) |
| (8) |
| (9) |
The variance component estimates are as follows:
| (10) |
| (11) |
| (12) |
and the estimate of Var(ȳ) is as follows:
| (13) |
| (14) |
The Type A standard uncertainty was calculated according to Eq. (14), and the results obtained are shown in Table 7. The combined standard uncertainty (uc) associated with each method mean was calculated according to Eq. (15) from three contributions. These are Type A (uTypeA), calibration process (ucal), and sample preparation (usp). However, in case of analysis by M2, the sample was diluted to be measured in the range of calibration of the UV/Vis spectrophotometer, and therefore, a factor of uncertainty of dilution (0.0101) was added to the uncertainty of sample preparation. The calculated uncertainty results are also given in Table 7.
Table 7.
Arithmetic Mean and the combined standard uncertainty of the two methods.
| Method | Mean | U Type A | U cal | U sp | U c |
|---|---|---|---|---|---|
| M1 | 99.903 | 0.0032 | 0.3475 | 0.0007 | 0.3475 |
| M2 | 99.832 | 0.0072 | 0.3411 | 0.0102 | 0.3412 |
M1 = Method 1; M2 = Method 2.
| (15) |
3.7.3. Between-method variance and method weights
If all measurements are unbiased and independent, then it is well known that using a weight for each measurement that is inversely proportional to its variance leads to an unbiased estimate of the true value with minimum variance [15,16]. The measured values produced by each method are modeled as the sum of the true property value, method bias, and random error, as described by Eq. (15).
| (16) |
Method weights are derived by assuming that the random errors (ei) are independent, have means equal to 0, and have different variance for each method. The variance may be estimated from the between-method differences. Under this model, the variance of the average of ni measurements from the ith method is as follows:
| (17) |
Averaging the method means that the use of weights proportional to the inverse of this variance leads to an estimate of the true value with minimum variance. The between-method variance is illustrated in Table 8. The weight for each method is inversely proportional to the sum of the variance of its mean and the between-method variance [15–17]. The Paule–Mandel weighting scheme involves the use of an algorithm for estimating the between-method variance and the square of its combined standard uncertainty . Then the method weight is defined implicitly as follows:
Table 8.
Between-method variance, method weights, and weighing factor of each method.
| Method | Between-method variance | Method weight (Wi) | Weighing factor (wi) |
|---|---|---|---|
| M1 | 0.018 | 8.260 | 0.491 |
| M2 | 8.567 | 0.509 |
M1 = Method 1; M2 = Method 2.
| (18) |
The weighing factor is the following:
| (19) |
3.7.4. Uncertainty of the between-bottle variability
Uncertainty due to the between-bottle variability ubb was calculated using Eq. (1) [22–29] and found to be 0.013.
3.7.5. Certified value (average weighted mean) and its uncertainty
Results in Table 1 were combined to investigate whether they provide certified or reference values. To combine the results, a weighted average of the method means was computed according to the weighting algorithm of Paule and Mandel, which is often implemented for combining data from independent chemical analysis methods [15–19]. The weight of each method is inversely proportional to the sum of the variance of its mean and the between-method variance. The weighted average X of the Xi is given as follows:
| (20) |
| (21) |
Using this weighting scheme, the method weights, weighted means, and average weighted mean have been calculated, and the results are tabulated in Table 9.
Table 9.
Weighted mean, average weighted mean, and weighted uncertainty of each method.
| Method | Weighted mean | Average weighted mean | Weighted uncertainty |
|---|---|---|---|
| M1 | 49.040 | 99.862 | 0.344 |
| M2 | 50.822 |
M1 = Method 1; M2 = Method 2.
3.7.6. Bias allowance
Bias allowance is a systematic error due to the difference in methods. It is taken as the maximum absolute deviation of any method mean from the weighted mean, as expressed in Eq. (21) [5,15,17]. It has been calculated and reported in Table 10 as 0.041.
Table 10.
Certified purity % and its associated uncertainty.
| Certified purity % | S2(X̃) | Bias allowance | U% | |
|---|---|---|---|---|
| 99.86 | 0.344 | 0.013 | 0.041 | ±0.65 |
| (22) |
3.7.7. Certified uncertainty
For estimation of the interval of the certified value, the effective degree of freedom of the total variance was calculated from Eq. (23) and was found to be 38, which from the t table corresponds to a coverage factor k nearly equal to 2.
| (23) |
The certified uncertainty U associated with the certified caffeine purity (average weighted mean) was then calculated from three sources according to Eq. (24). These sources are the weighted combined standard uncertainty S2(&Xtilde;), the material variability , and the bias allowance. Values were calculated and are listed in Table 10.
| (24) |
4. Conclusion
Caffeine was extracted from roasted coffee, purified, and then bottled as RM. The purity % of this RM was certified by reversed-phase liquid chromatography/DAD and by UV/Vis spectrophotometry as two independent analytical techniques. The results obtained by the two methods were in very good agreement, and were combined to drive the certified value and its associated uncertainty. The certified caffeine purity was found to be 99.86% and the associated uncertainty to be ±0.65%. This high-purity caffeine CRM would be a very useful calibrant for analytical laboratories performing food and drug analysis.
Footnotes
Conflicts of interest
Each of the contributing authors has no conflict of interest.
REFERENCES
- 1. İçen H, Gürü M. Extraction of caffeine from tea stalk and fiber wastes using supercritical carbon dioxide. J Supercrit Fluids. 2009;50:225–8. [Google Scholar]
- 2.Belitz HD, Grosch W, Schieberle P. Coffee, tea, cocoa Food chemistry. 4th ed. Berlin: Springer-Verlag; 2009. pp. 938–70. [Google Scholar]
- 3. Sander LC, Bedner M, Tims MC, Yen JH, Duewer DL, Porter B, Christopher SJ, Day RD, Long SE, Molloy JL, Murphy KE. Development and certification of green tea-containing standard reference materials. Anal Bioanal Chem. 2012;402:473–87. doi: 10.1007/s00216-011-5472-7. [DOI] [PubMed] [Google Scholar]
- 4. Thomas JB, Yen JH, Schantz MM, Porter BJ, Sharpless KE. Determination of caffeine, theobromine, and theophylline in standard reference material 2384, baking chocolate using reversed-phase liquid chromatography. J Agric Food Chem. 2004;52:3259–63. doi: 10.1021/jf030817m. [DOI] [PubMed] [Google Scholar]
- 5. Thomas JB, Sharpless KE, Mitvalsky S, Roman M, Yen J, Satterfield MB. Determination of caffeine and caffeine-related metabolites in ephedra-containing standard reference materials using liquid chromatography with absorbance detection and tandem mass spectrometry. J AOAC Int. 2007;90:934–40. [PubMed] [Google Scholar]
- 6. Sharpless KE, Anderson DL, Betz JM, Butler TA, Capar SG, Cheng J, Fraser CA, Gardner G, Gay ML, Howell DW, Ihara T. Preparation and characterization of a suite of ephedra-containing standard reference materials. J AOAC Int. 2006;89:1483–95. [PubMed] [Google Scholar]
- 7.ISO/IEC 20481 2008. Coffee and coffee products—determination of the caffeine content using high performance liquid chromatography (HPLC)—reference method. Geneva, Switzerland: International Organization of Standardization (ISO); 2005. [Google Scholar]
- 8. Belay A, Ture K, Redi M, Asfaw A. Measurement of caffeine in coffee beans with UV/vis spectrometer. Food Chem. 2008;108:310–5. [Google Scholar]
- 9. Khoshayand M, Abdollahi H, Shariatpanahi M, Saadatfard A, Mohammadi A. Simultaneous spectrophotometric determination of paracetamol, ibuprofen and caffeine in pharmaceuticals by chemometric methods. Spectrochim Acta Part A. 2008;70:491–9. doi: 10.1016/j.saa.2007.07.033. [DOI] [PubMed] [Google Scholar]
- 10. Shehata AB, Rizk MS, Farag AM, Tahoun IF. Certification of three reference materials for α-and γ-tocopherol in edible oils. Mapan. 2014;29:183–94. [Google Scholar]
- 11. Shehata AB, Rizk MS, Farag AM, Tahoun IF. Development of two reference materials for all trans-retinol, retinylpalmitate, α-and γ-tocopherol in milk powder and infant formula. J Food Drug Anal. 2015;23:82–92. doi: 10.1016/j.jfda.2014.10.004. [DOI] [PMC free article] [PubMed] [Google Scholar]
- 12. Shehata AB, Tahoun IF. Preparation and certification of a fish oil natural matrix reference material for organochlorine pesticides. Accredit Qual Assur. 2010;15:563–8. [Google Scholar]
- 13. Danzer K, Currie LA. Guidelines for calibration in analytical chemistry. Part I. Fundamentals and single component calibration (IUPAC Recommendations 1998) Pure Appl Chem. 1998;70:993–1014. [Google Scholar]
- 14.BIPM, IEC, IFCC, ISO, IUPAP, IUPAC, OIML. Guide to the expression of uncertainty in measurement. 1st ed. Geneva, Switzerland: ISO; 1993. corrected and reprinted 1995. [Google Scholar]
- 15. Epstein MS. The independent method concept for certifying chemical-composition reference materials. Spectrochim Acta Part B. 1991;46:1583–91. [Google Scholar]
- 16.Schiller SB. Statistical aspects of the certification of chemical batch SRMs. Gaithersburg, Maryland, USA: US Department of Commerce Technology Administration, NIST; 1996. [Google Scholar]
- 17. Schiller S, Eberhardt KR. Combining data from independent chemical analysis methods. Spectrochim Acta Part B. 1991;46:1607–13. [Google Scholar]
- 18. Nalobin D, Osintseva E. Calculating uncertainty for certified values for reference specimens. Meas Tech. 2007;50:259–65. [Google Scholar]
- 19. Hässelbarth W, Bremser W, Pradel R. Uncertainty-based evaluation of certification study data. Fresenius J Anal Chem. 1998;360:317–21. [Google Scholar]
- 20.Meier PC, Zünd RE. Statistical methods in analytical chemistry. 2nd ed. New York: John Wiley & Sons; 2005. [Google Scholar]
- 21.Ellison S, Williams A. Eurachem/CITAC guide: quantifying uncertainty in analytical measurement. Leoben, Austria: EURACHEM; 2012. 2013. [Google Scholar]
- 22. Van der Veen AM, Linsinger TP, Pauwels J. Uncertainty calculations in the certification of reference materials. Accredit Qual Assur. 2001;6:26–30. [Google Scholar]
- 23. Linsinger TP, Pauwels J, Van der Veen AM, Schimmel H, Lamberty A. Homogeneity and stability of reference materials. Accredit Qual Assur. 2001;6:20–5. [Google Scholar]
- 24. Pauwels J, Lamberty A, Schimmel H. Homogeneity testing of reference materials. Accredit Qual Assur. 1998;3:51–5. [Google Scholar]
- 25. Ulberth-Buchgraber M, Potalivo M, Emteborg HK, Held A. Toward the development of certified reference materials for effective biodiesel testing. Part 1: processing, homogeneity, and stability. Energy Fuels. 2011;25:4622–9. [Google Scholar]
- 26. Lee S, Miyaguchi H, Han E, Kim E, Park Y, Choi H, Chung H, Oh SM, Chung KH. Homogeneity and stability of a candidate certified reference material for the determination of methamphetamine and amphetamine in hair. J Pharm Biomed Anal. 2010;53:1037–41. doi: 10.1016/j.jpba.2010.06.023. [DOI] [PubMed] [Google Scholar]
- 27. Jiménez C, Ventura R, Segura J, De la Torre R. Protocols for stability and homogeneity studies of drugs for its application to doping control. Anal Chim Acta. 2004;515:323–31. [Google Scholar]
- 28. Van der Veen A, Pauwels J. Uncertainty calculations in the certification of reference materials. 1. Principles of analysis of variance. Accredit Qual Assur. 2000;5:464–9. [Google Scholar]
- 29. Koch M, Bremser W, Köppen R, Krüger R, Rasenko T, Siegel D, Nehls I. Certification of reference materials for ochratoxin A analysis in coffee and wine. Accredit Qual Assur. 2011;16:429–37. [Google Scholar]
- 30. Van der Veen AM, Linsinger TP, Lamberty A, Pauwels J. Uncertainty calculations in the certification of reference materials. Accredit Qual Assur. 2001;6:257–63. [Google Scholar]


