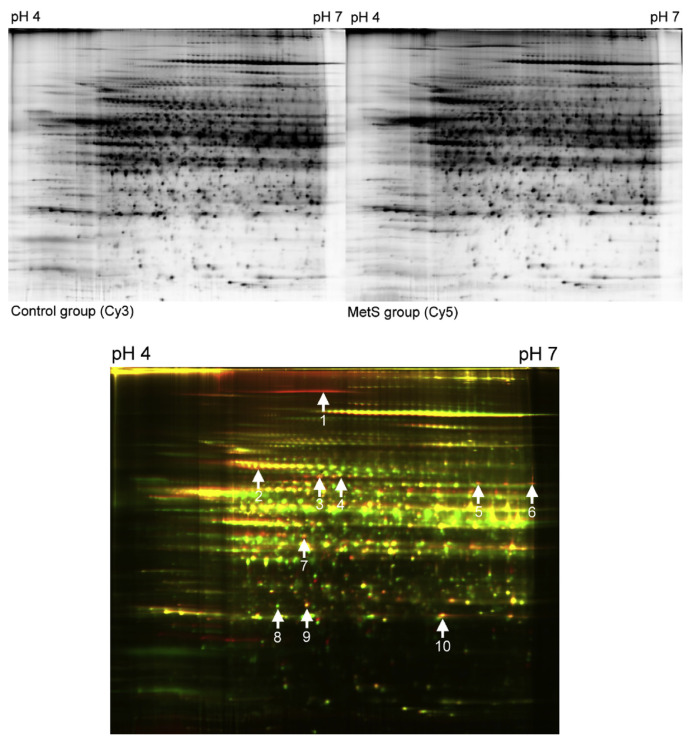
Figure 1.
Two-dimensional difference gel electrophoresis (2D-DIGE) analysis of the rat liver in the metabolic syndrome (MetS) group (Cy 5) versus the control group (Cy3). Analysis of the resulting 2D-DIGE gel images show 10 protein spots are differentially expressed between the MetS and control groups. Of these, eight protein spots are upregulated and two protein spots are downregulated. Differentially expressed protein spots were excised from preparative gels, in-gel digested with trypsin, and analyzed using MALDI-TOF/MS-MS. Several proteins are represented by spots. MALDI-TOF/MS-MS = Matrix-assisted laser desorption/ionization-time-of-flight/mass spectroscopy-mass spectroscopy.

