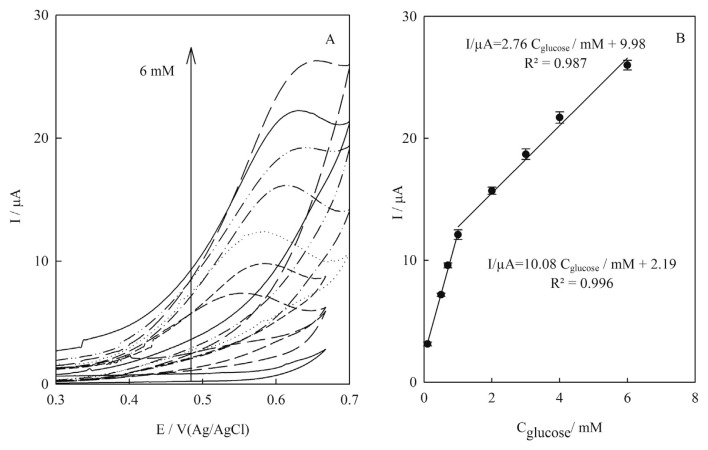
Figure 7.
(A) Cyclic voltammograms of Cu(nanoparticle)-pencil graphite electrode in 0.1M NaOH containing glucose in various concentrations from down to top: 0.0–6.0mM at scan rate 10.0 mVs−1; (B) linear correlation between electrocatalytic peak currents of cyclic voltammograms of Cu(nanoparticle)-pencil graphite electrode and glucose concentrations from 0.1mM to 1mM and from 1.0mM to 6.0mM. Error bars indicated standard deviations (n = 3).

