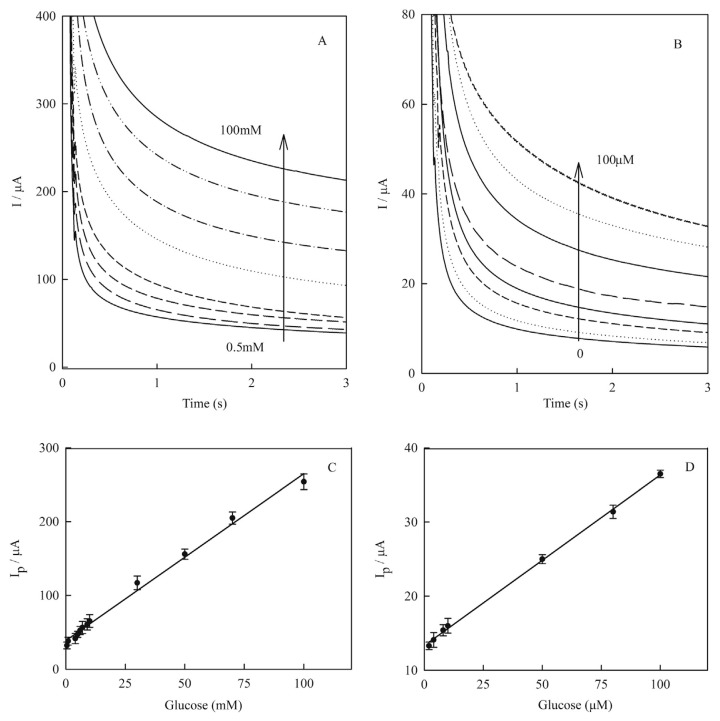
Figure 9.
Amperometric response curve of Cu(nanoparticle)-pencil graphite electrode in 0.1M NaOH containing glucose in various concentrations: (A) from 0.5mM to 100.0mM; (B) from 0.0mM to 100.0μM. Amperometry was carried out at fixed applied potential of +0.55 V. Linear correlation between electrocatalytic peak currents of amperograms of Cu(nanoparticle)-pencil graphite electrode and glucose concentrations: (C) from 0.5mM to 100.0mM as {Ip/μA = 2.26(±0.06) [glucose]/mM + 38.66(±2.45)/μA, R2 = 0.992}; and (D) from 1.0mM to 100.0μM as {Ip/μA = 0.23(±0.003) [glucose]/μM + 13.31(±0.18)/μA, R2 = 0.998}. Error bars indicated standard deviations (n = 3).

