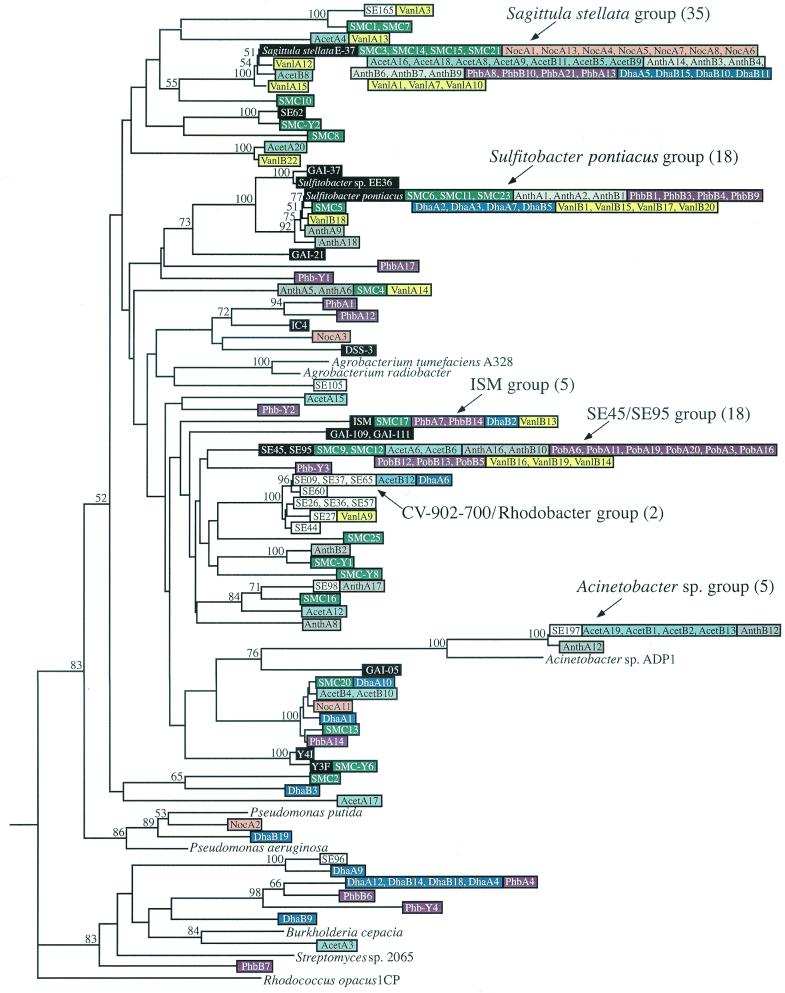
FIG. 2.
Phylogenetic tree of pcaH sequences from isolates, the natural salt marsh community, and the enrichment communities. The tree is based on the 159 nucleotides located in between the degenerate primer binding sites and is unrooted; pcaH from Rhodoccocus opacus 1CP is the outgroup. Major clone groups are indicated, and the numbers in parentheses are the numbers of clones. Isolate sequences are color coded with either black type (sequences from roseobacter group isolates) or white type (sequences from members of other phylogenetic groups). Sequences from the salt marsh community and enrichment communities are color coded by treatment and are identified by the designations shown in Table 1. Bootstrap values greater than 50% are indicated at branch nodes.

