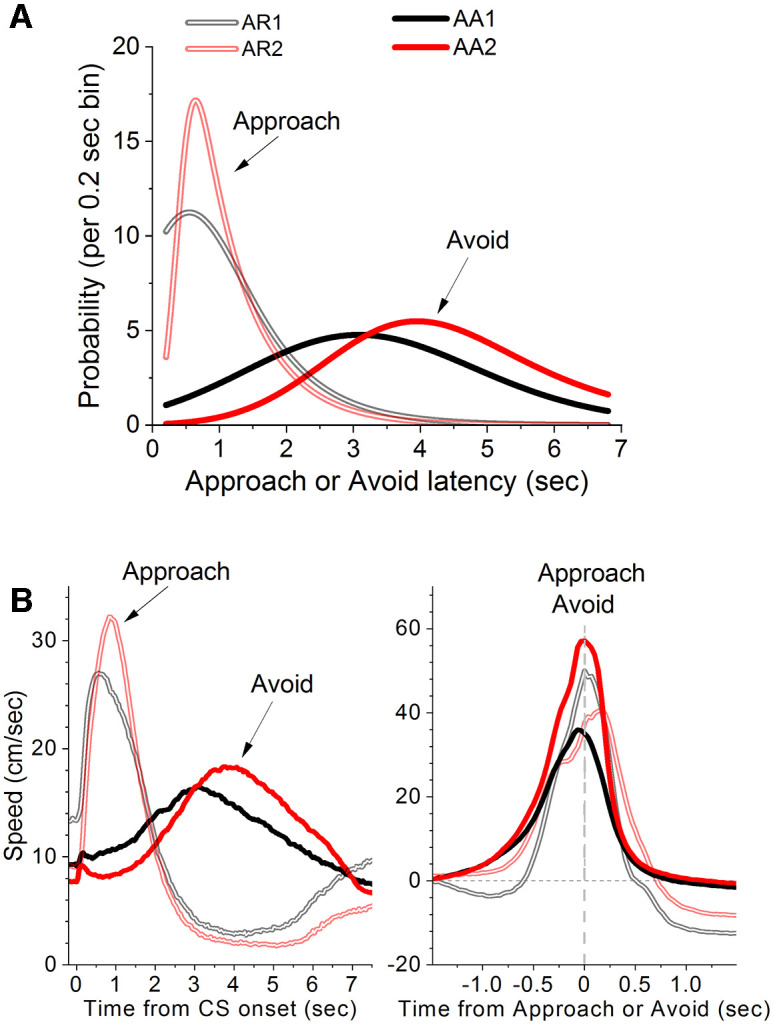
Figure 10.

Comparison of signaled active avoidance and approach responses. A, Probability histogram (%) of response latencies for two groups of mice fitted with an exponential Gaussian. One group performed AR1 and AR2 (proper), the other group performed AA1 and AA2. B, Mean speed traces for the data in A aligned by the CS onset (left) or by the response occurrence (right; baselined-corrected).
