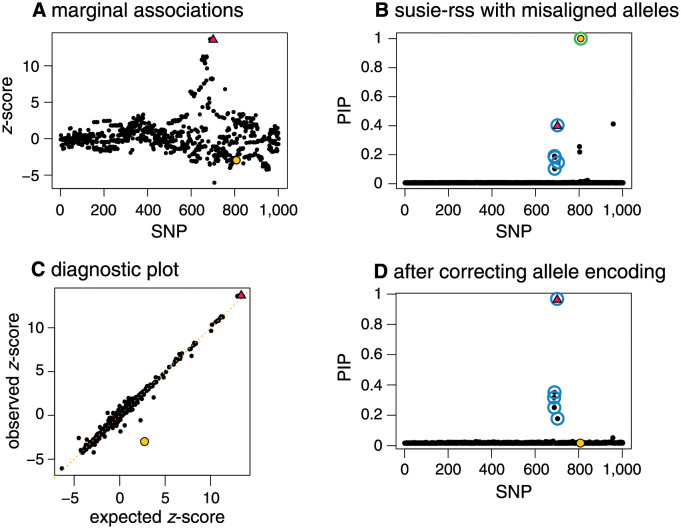
Fig 1. Example illustrating importance of identifying and correcting allele flips in fine-mapping.
In this simulated example, one SNP (red triangle) affects the phenotype, and one SNP (yellow circle) has a different allele encoding in the study sample (the data used to compute the z-scores) and the reference panel (the data used to compute the LD matrix). Panel A shows the z-scores for all 1,002 SNPs. Panel B summarizes the results of running SuSiE-RSS on the summary data; SuSiE-RSS identifies a true positive CS (blue circles) containing the true causal SNP, and a false positive CS (green circles) that incorrectly contains the mismatched SNP. The mismatched SNP is also incorrectly estimated to have an effect on the phenotype with high probability (PIP = 1.00). The diagnostic plot (Panel C) compares the observed z-scores against the expected z-scores. In this plot, the mismatched SNP (yellow circle) shows the largest difference between observed and expected z-scores, and therefore appears furthest away from the diagonal. After fixing the allele encoding and recomputing the summary data, SuSiE-RSS identifies a single true positive CS (blue circles) containing the true-causal SNP (red triangle), and the formerly mismatched SNP is (correctly) not included in a CS (Panel D). This example is implemented as a vignette in the susieR package.

