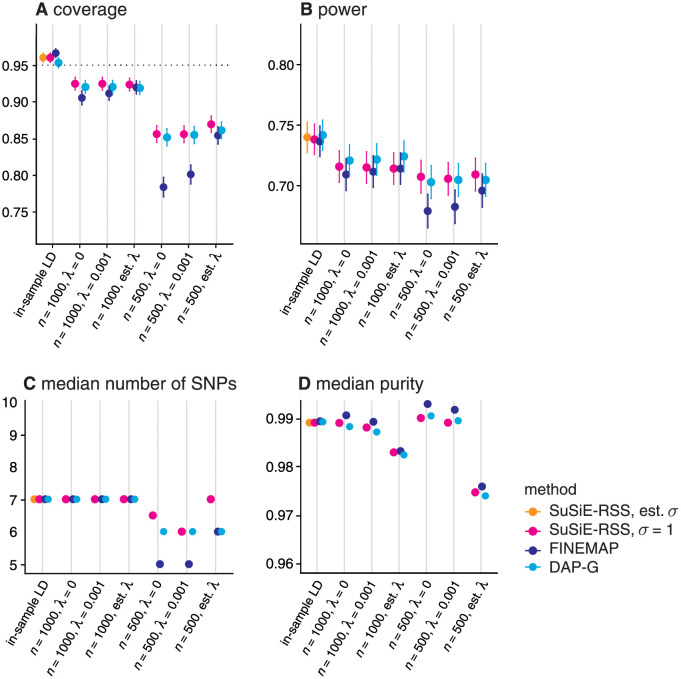
Fig 4. Assessment of 95% credible sets from SuSiE-RSS, FINEMAP and DAP-G with different LD estimates, and different LD regularization methods.
For in-sample LD, two variants of SuSiE-RSS were also compared (see Table 1): when the residual variance σ2 was estimated (“sufficient data”), or fixed to 1 (“summary data”). We evaluate the estimated CSs using the following metrics: (A) coverage, the proportion of CSs that contain a true causal SNP; (B) power, the proportion of true causal SNPs included in a CS; (C) median number of SNPs in each CS; and (D) median purity, where “purity” is defined as the smallest absolute correlation among all pairs of SNPs within a CS. These statistics are taken as the mean (A, B) or median (C, D) over all simulations; error bars in A and B show two times the standard error. The target coverage of 95% is shown as a dotted horizontal line in Panel A. Following [17], we discarded all CSs with purity less than 0.5.

