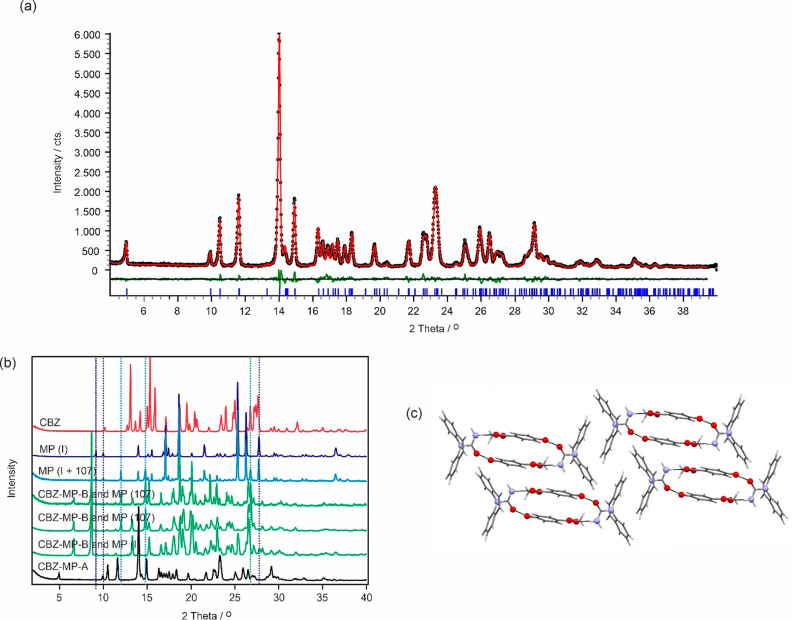
Figure 4.
(a) Observed (black points), calculated (red line), and difference profiles (green) for the Rietveld refinements of the CARB/CEBG-A cocrystal. Blue tick marks denote the peak positions. (b) Comparison of the carbamazepine (CARB, red), methyl paraben (polymorph I and a mixture of I and 107, blue) products obtained after evaporating 1:1 mixtures of the two components from acetonitrile and ethanol (green), and the CARB/CEBG-A cocrystal (black). Dotted lines indicate selected key reflection peak positions of methyl paraben polymorphs I and 107. (c) Packing diagram CARB/CEBG-A viewed along the a crystallographic axis.

