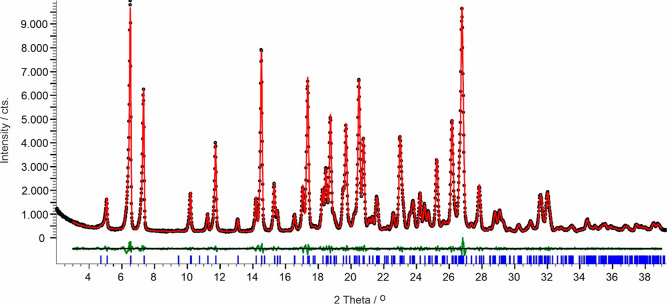
Figure 5.
For the hkl reflections (Rwp = 3.91%) between the reflection PXRD data of CARB/TELZ with a model consisting of the cell parameters derived from indexing. Black dots indicate raw data, while the red line indicates the calculated model. The difference pattern is shown in green. Tick marks (blue) are the 2θ positions for the hkl reflections Pawley fit.

