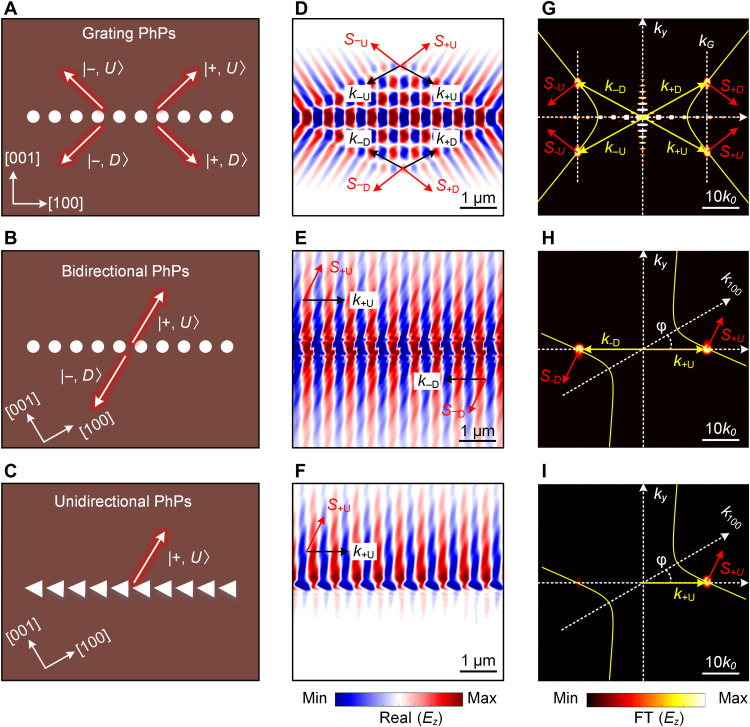
Fig. 2. Theoretical analysis of PhP diffraction and symmetry breaking at grating in α-MoO3.
(A to C) Schematic of normal grating, bidirectional, and unidirectional diffraction of PhPs at nanogratings. The gratings are oriented φ = 0° and 30° relative to the [100] crystal direction of α-MoO3. Red arrows indicated the energy flow S for each diffraction state. The grating period is Λ = 600 nm, the hole diameter is 300 nm, the triangle hole size is 600 × 400 nm, and the α-MoO3 slab thickness is d = 200 nm. (D to F) Numerically simulated electric field distribution Ez of the PhPs excited by gratings in (A) to (C) at frequency 920 cm−1. (G and H) FT of the simulated field distributions shown in (D) and (E). The yellow lines show the analytical hyperbolic isofrequency contours of PhPs in α-MoO3. The bright spots reveal the wave vectors (momenta) of the grating-excited PhPs, which are located at the intersections of the vertical line of the grating’s reciprocal lattice vector (kG = ±2π/Λ) and the isofrequency contours of the PhP momenta. (I) The right-half image corresponds to the FT of the up-side PhPs in (F) with a bright +1st-order FT spot, and the left-half image correspond to the FT of the down-side PhPs in (F) with a weak −1st-order FT spot.

