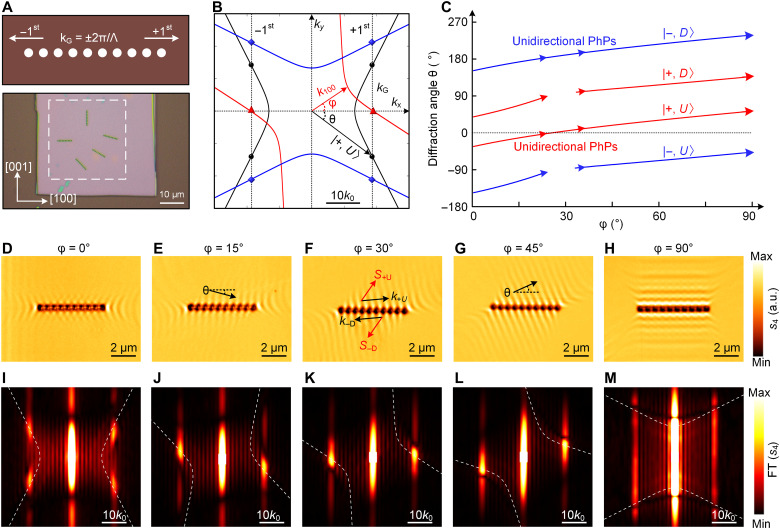
Fig. 3. Experimental observation of directional diffraction of tip-launched PhPs at circular-hole gratings.
(A) Schematic (top) of circular-hole grating and optical image (bottom) of a 220-nm-thick α-MoO3 sample on an SiO2/Si substrate with differently oriented gratings (Λ = 600 nm; diameter, 300 nm). (B) Isofrequency contours of the PhP wave vector for different grating orientations relative to the [100] crystal direction of α-MoO3 (φ = 0°, 30°, and 90°, respectively) at frequency 904 cm−1. The symbols denote the diffraction wave vector of tip-launched PhPs at each rotation angle. All isofrequency contours were multiplied by a factor of two, because of the double optical path of tip-launched PhPs. (C) Diffraction angle θ of the four diffraction states as function of grating orientation φ. (D to H) Experimentally measured near-field amplitude images (s4) of tip-launched PhPs for different oriented grating. (I to M) FT of the experimental near-field images shown in (D) to (H), respectively. The bright spots reveal the momenta of tip-launched PhPs, which are exactly located at the analytically calculated isofrequency curves of the PhP momenta (dashed lines).

