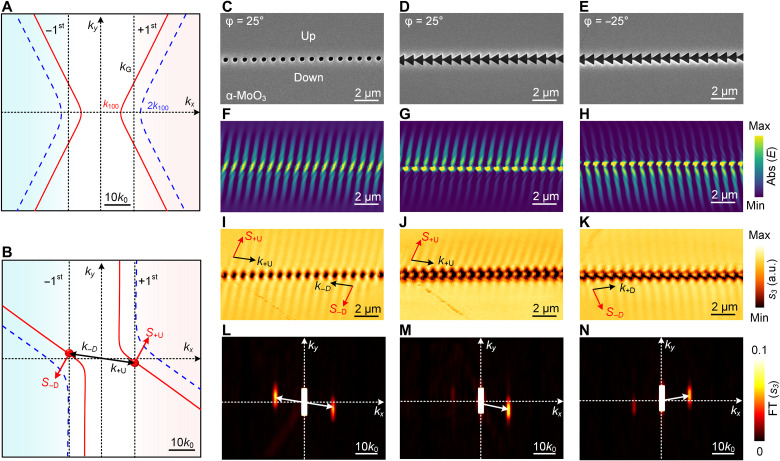
Fig. 4. Experimental observation of grating-excited PhPs and their unidirectional diffraction.
(A) Momentum matching in diffraction for a grating oriented at φ = 0°, illustrated by isofrequency contours. The first-order diffraction of tip-launched PhPs (represented by the blue dashed line) is forbidden because kG < 2k100, whereas the diffraction of grating-excited PhPs is possible because of the intersection of the vertical dashed line at kG = ±2π/Λ with the isofrequency contour of the grating-excited PhPs. (B) Momentum matching for a grating oriented at φ = 25°; the black (red) arrows indicates the wave vector (energy flow) for bidirectional (circular-hole grating) diffraction. (C to E) Scanning electron microscopy images of the α-MoO3 samples with circular-hole and blazed gratings. The thickness of the flake is 182 nm, with grating period Λ = 800 nm, circular-hole diameter 400 nm, and triangle size 800 × 1000 nm. (F to H) The simulated wavefronts [abs(E)] of PhPs excited by gratings in (C) to (E) at frequency 904 cm−1. (I to K) Processed near-field images of first-order diffraction of grating-excited PhPs (the processing steps are detailed in fig. S11), showing (I) bidirectional PhP wavefronts at both sides of the circular-hole grating and unidirectional PhPs wavefront at the up-side (J) or bottom-side (K) of the blazed grating by inverting the orientation angle from +25° to −25°. (L to N) Processed FT images of grating-excited PhPs in (I) to (K), where the right-half images correspond to FT of +1st-order diffraction of PhPs, and the left-half images correspond to the FT of −1st-order diffraction of PhPs. The two half images are then spliced together into the final FT result as shown in (L) to (N). The right and left spots off the center correspond to the FT intensity of forward (+1st-order) and backward (−1st-order) diffraction of grating-excited PhPs in (I) to (K).

