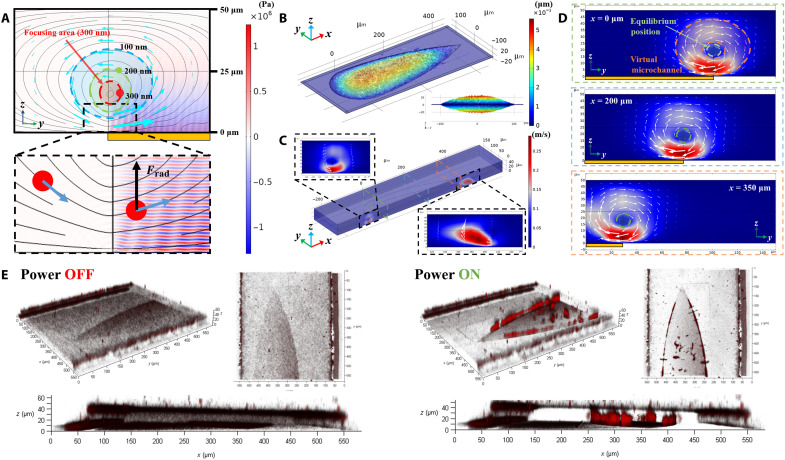
Fig. 2. Design and test of the Fan-BAW device.
(A) Force analysis of SteAS-based focusing. The nanoparticles are focused into the center of the vortices due to Frad (black arrows) and Fdrag (blue arrows). The schematic shows the focusing area (ID of the virtual channel) for 300-nm (red), 200-nm (green), and 100-nm (blue) nanoparticles. The color surface, black curves, and cyan blue arrows represent the acoustic pressure, streamlines, and fluid vectors, respectively. The yellow rectangle indicates the position of the UHF BAW device. (B) 3D simulation results of the vibration mode (thickness extension mode) of the Fan-BAW device. (C) 3D simulation results of the distribution of acoustic vortices induced by Fan-BAWs. Detailed images show the shape of the vortex triggered by the arc edges and the vertex in the x-z plane. The slide positions (x = 0, 200, and 350 μm) are represented by green, blue, and orange dashed rectangles. (D) Distribution of the acoustic streaming vortices in different section views (x = 0, 200, and 350 μm). The equilibrium position, the adaptive range of the virtual channel, and the position of the device are indicated by the green dashed circles, orange dashed ring, and yellow rectangles, respectively. (E) 3D images of the distribution of the fluorescent nanoparticles (300 nm) before and after enrichment.

