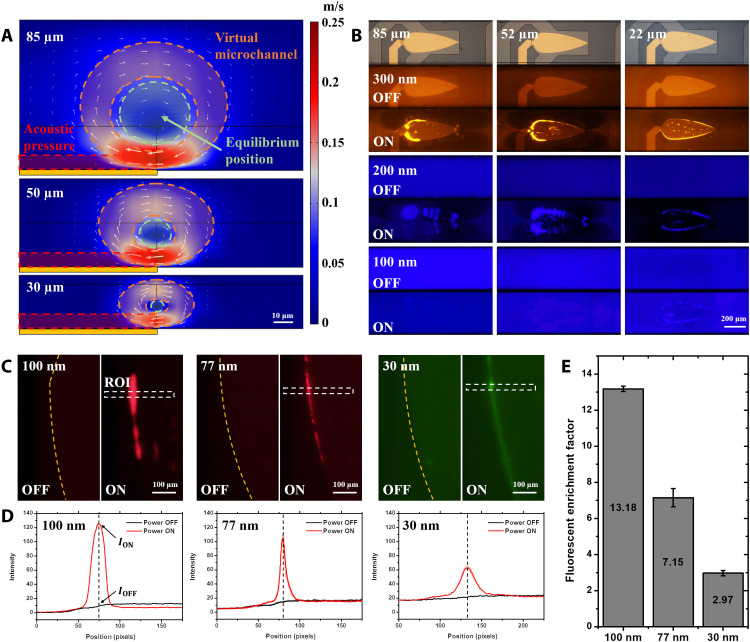
Fig. 3. Height effect and in situ enrichment.
(A) Section view of the virtual channel formed by the SteAS with microfluidic channels of different heights. Scale bar, 10 μm. The adaptive boundary of the virtual microchannel, the equilibrium position, and the acoustic pressure area (defined by the decay length of acoustic waves) are represented by the orange ring, the green circle, and the red rectangle. The color bar represents the velocity of the stream. (B) Fluorescent images of the enriched PS nanoparticles (300, 200, and 100 nm) with different microchannel heights (85, 52, and 22 μm). Scale bar, 200 μm. (C) Fluorescent images of PS nanoparticles (100, 77, and 30 nm) before and after the in situ enrichment. The virtual microchannel is confined by a 22-μm-high microchannel. When the device is turned off, the fluorescent nanoparticles are uniformly dispersed; when the device is turned on, the nanoparticles are enriched into the virtual microchannel. The boundaries of the Fan-BAW device and ROI are marked by the yellow dashed lines and white dashed rectangles. Scale bars, 100 μm. (D) Fluorescent intensity of images before and after in situ enrichment in the ROI (n = 3). The lateral positions of the intensity peak after enrichment are marked by black dashed lines. The values of ION and IOFF are pointed by black arrows. (E) Fluorescent enrichment factor of the in situ enrichment (100-, 77-, and 30-nm PS nanoparticles).

