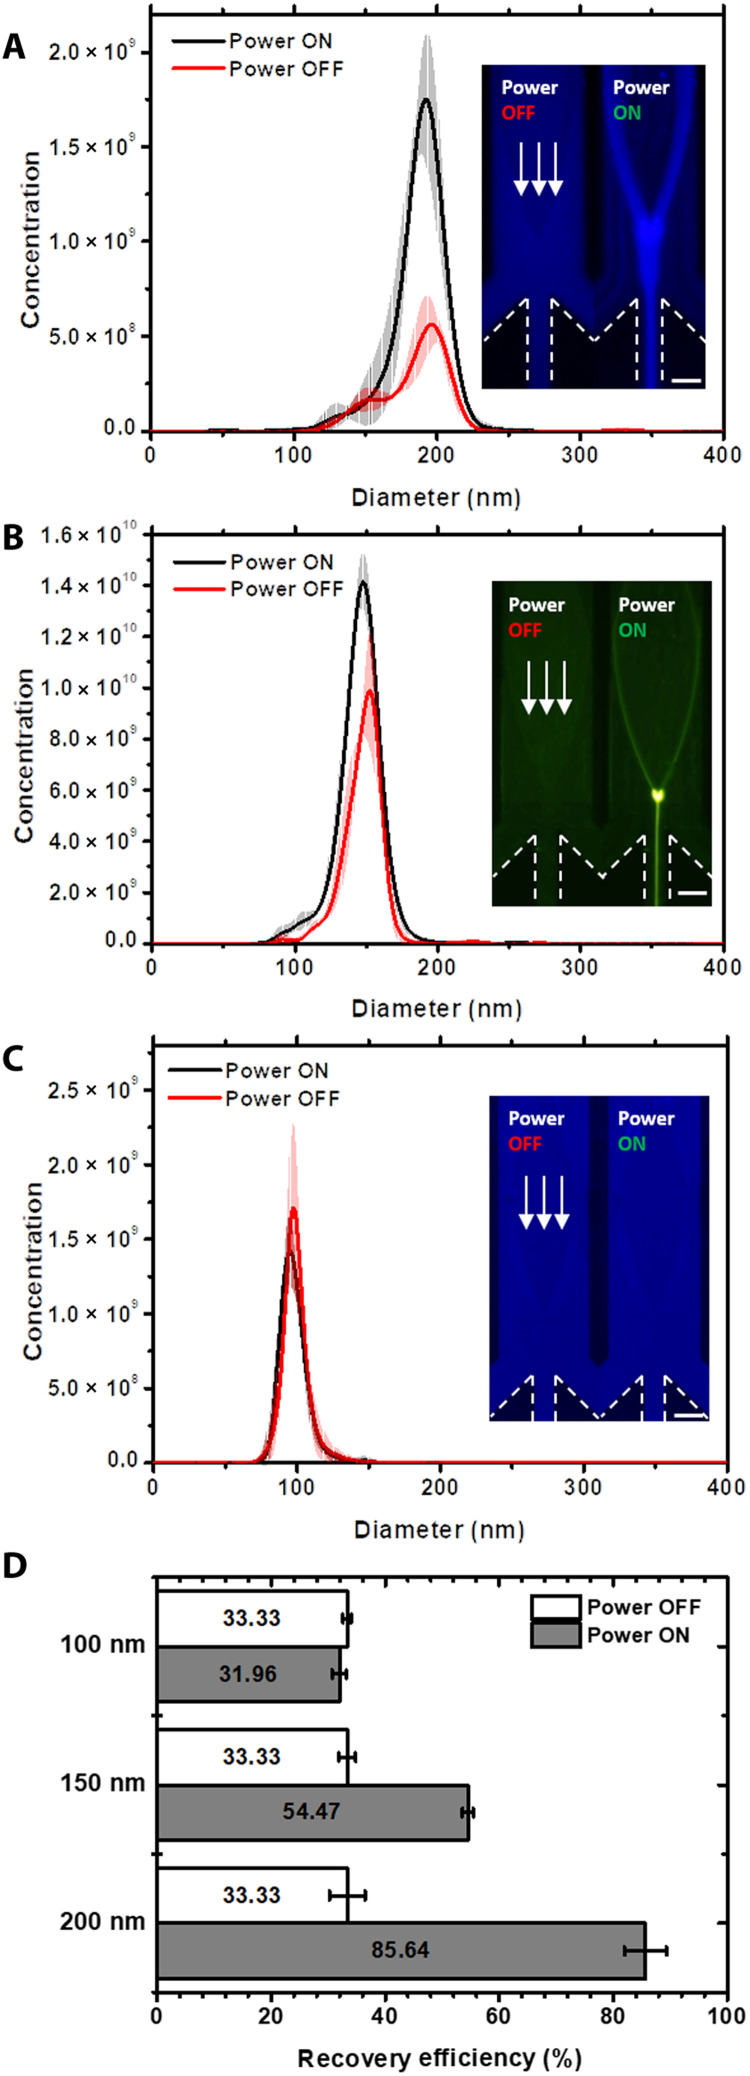
Fig. 6. Size-relative continuous focusing of nanoparticles.
(A to C) Size distribution and concentration of the 200-, 150-, and 100-nm nanoparticles before and after continuous focusing. The images in the left show the morphologies of the focused fluorescent PS nanoparticles with the same parameters. The applied power was 1660 mW, and the height of the microchannel was 22 μm. The flow rate of the inlet was 0.6 μl/min, and the flow rates of the three outlets were all −0.2 μl/min. The white arrows point in the direction of the lateral flow. The boundaries of outlets are highlighted by white dashed lines. Scale bars, 100 μm. (D) Recovery efficiency of the 200-, 150-, and 100-nm nanoparticles after continuous focusing, which is calculated by the ratio of the total amount of focused nanoparticles (the middle outlet) to the amount of injected nanoparticles.

