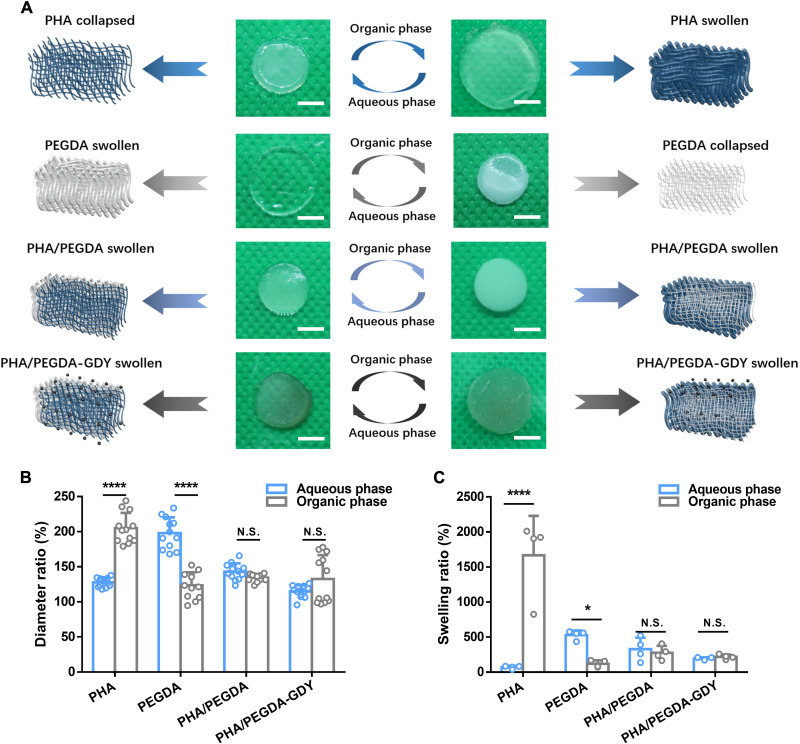
Fig. 2. Swelling performance of different gels.
(A) Optical images and corresponding schematic of PHA organogels, PEGDA hydrogels, PHA/PEGDA organohydrogels, and PHA/PEGDA-GDY organohydrogels after immersion in aqueous phase and organic phase. Scale bars, 5 mm. (B) The diameter ratio and (C) swelling ratio of the gels in aqueous phase and organic phase. [n = 12 (B) and n = 4 (C)]. ****P < 0.0001 and *P < 0.05 by two-way ANOVA with Sidak correction. N.S., not significant.

