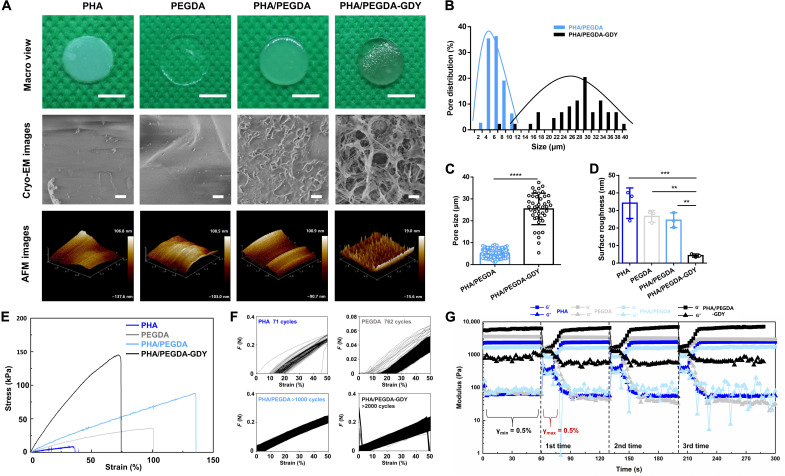
Fig. 3. Surface morphology and mechanical characterizations of different gels.
(A) Macro view, cryo-EM, and AFM images of the gels. Scale bars, 5 mm (macro view) and 10 μm (cryo-EM images). The concentration of GDY is 0.1%. (B) Pore distribution and (C) pore size of the organohydrogels have been plotted. ****P < 0.0001 by unpaired, two-sided t test. (D) Surface roughness of the gels was analyzed from AFM images. n = 3, ***P < 0.001 and **P < 0.01 by one-way analysis of variance (ANOVA) with Tukey correction. (E) Stress-strain curve under tension of the gels. (F) Cyclic tensile test of the gels, demonstrating the maximal number of cycles that gels could bear. (G) The modulus as a function of time at a constant frequency of 1 rad/s for the gels at intermittent changes of shear strain amplitudes (γmin = 0.5% and γmax = 100%).

