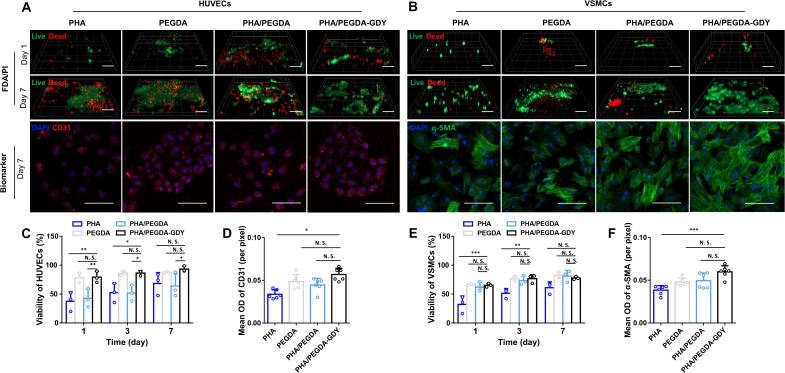
Fig. 4. In vitro cell biocompatibility of different gels.
(A) HUVECs and (B) VSMCs implantation in gels with FDA (green)/PI (red) and corresponding biomarker CD31 (red)/α–smooth muscle actin (α-SMA) (green)/nuclei (blue) immunofluorescence staining. Scale bars, 100 μm (FDA/PI staining) and 200 μm (biomarker staining). Viability of HUVECs (C) and VSMCs (E) plotted by analysis of the results of biocompatibility experiments. n = 3, ***P < 0.001, **P < 0.01, and *P < 0.05 by two-way ANOVA with Tukey correction. Mean optical density (OD) of CD31 (D) and α-SMA (F) were analyzed. n = 6, ***P < 0.001 and *P < 0.05 by one-way ANOVA with Sidak correction.

