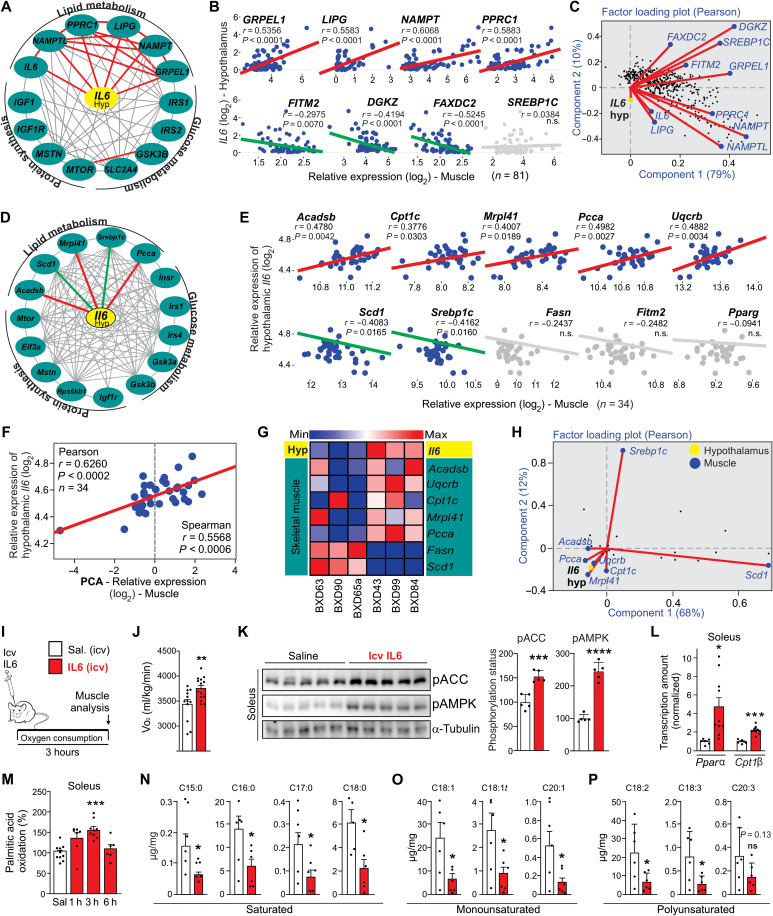
Fig. 1. Hypothalamic IL6 induces fatty acid oxidation in muscle.
(A) Interaction and (B) Pearson’s correlation graphs show the correlation between hypothalamic IL6 gene expression and several genes of human skeletal muscle. Gray line represents no correlation. Pearson’s correlation r ≥ |0.5| and P < 0.05 (n = 81). n.s., not significant. (C) Factor loading plot: angles more than 90° between gene vectors represent a negative correlation. (D) Interaction and (E) Pearson’s correlation graphs. Pearson’s correlation r ≥ |0.35| and P < 0.05 (n = 34). (F) PCA value was obtained using Acadsb, Cpt1c, Mrpl41, Pcca, and Uqcrc relative expression in the muscle of BXD mice. (G) Heatmap graph using hypothalamic and muscle transcripts from six different BXD mouse strains. (H) Factor loading plot (biplot) by using BXD cohort. (I) Experimental design using male C57BL6/J mice. (J) Oxygen consumption during 3 hours after recombinant IL6 intracerebroventricular (icv) microinjection (200 ng) (n = 11 to 14). (K) ACC and AMPK phosphorylation in the soleus muscle mice (n = 5). (L) Cpt1β and Pparα mRNA in the soleus muscle 3 hours after recombinant IL6 intracerebroventricular microinjection (n = 6 to 10). (M) Palmitic acid oxidation assay in the soleus muscle in mice intracerebroventricularly injected with IL6 (n = 6 to 10). (N to P) Determination of fatty acid fractions in the gastrocnemius muscle 3 hours after recombinant IL6 intracerebroventricular microinjection. Unpaired t test was used in (J) to (L) and (N) to (P). One-way analysis of variance (ANOVA) was used for statistical analysis in (M). *P < 0.05, **P < 0.01, ***P < 0.001, and ****P < 0.0001 versus saline.

