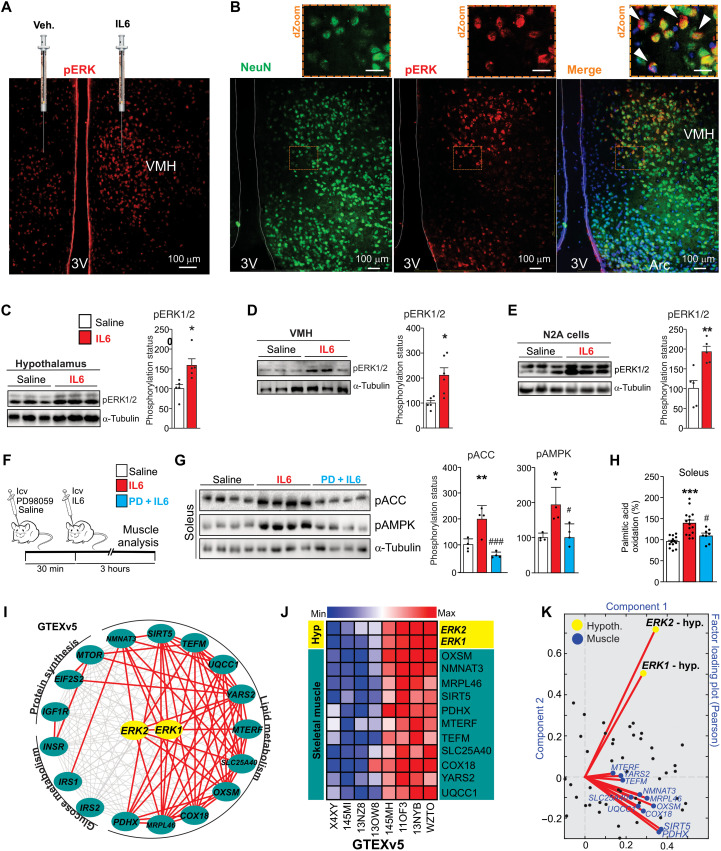
Fig. 2. Evaluation of hypothalamic IL6/ERK axis.
(A) Phospho-ERK1/2Thr202/Tyr204 (pERK1/2Thr202/Tyr204) staining in VMH 30 min after vehicle or recombinant IL6 injections. Scale bar, 100 μm. (B) pERK1/2 (red) staining in neurons (green) in VMH (n = 4). Scale bars, 100 μm. Top panels, digital zoom (dZoom). White arrowheads indicate double staining. Scale bars, 10 μm. (C) pERK1/2Thr202/Tyr204 30 min after recombinant IL6 intracerebroventricular microinjection (200 ng) in the whole hypothalamus (n = 5) and (D) in the ventromedial nucleus (n = 5 to 6). (E) pERK1/2Thr202/Tyr204 in N2A cells after recombinant IL6 incubation (50 ng/ml) for 60 min (n = 5). (F) Schematic view of the experiment. (G) ACCSer79 and AMPKThr172 phosphorylation in the soleus muscle (n = 4). (H) Palmitic acid oxidation in the soleus muscle (n = 8 to 15). (I) Interaction and (J) heatmap graphs show the positive correlation between hypothalamic ERK1/2 gene expression and genes related to lipid, glucose, and protein metabolism in the skeletal muscle of humans. Pearson’s r ≥ |0.35| and P < 0.05. n = 81. (K) Factor loading plot shows that hypothalamic ERK1/2 gene expressions positively correlate with genes related to fatty acid oxidation in the human muscle as seen on a factor loading plot, where angles less than 90° between gene vectors represent a positive correlation. Unpaired t test was used in (C) to (E). One-way ANOVA was used for statistical analysis in (G) and (H). *P < 0.05, **P < 0.01, and ***P < 0.001 versus saline and #P < 0.05 and ###P < 0.001 versus IL6.

