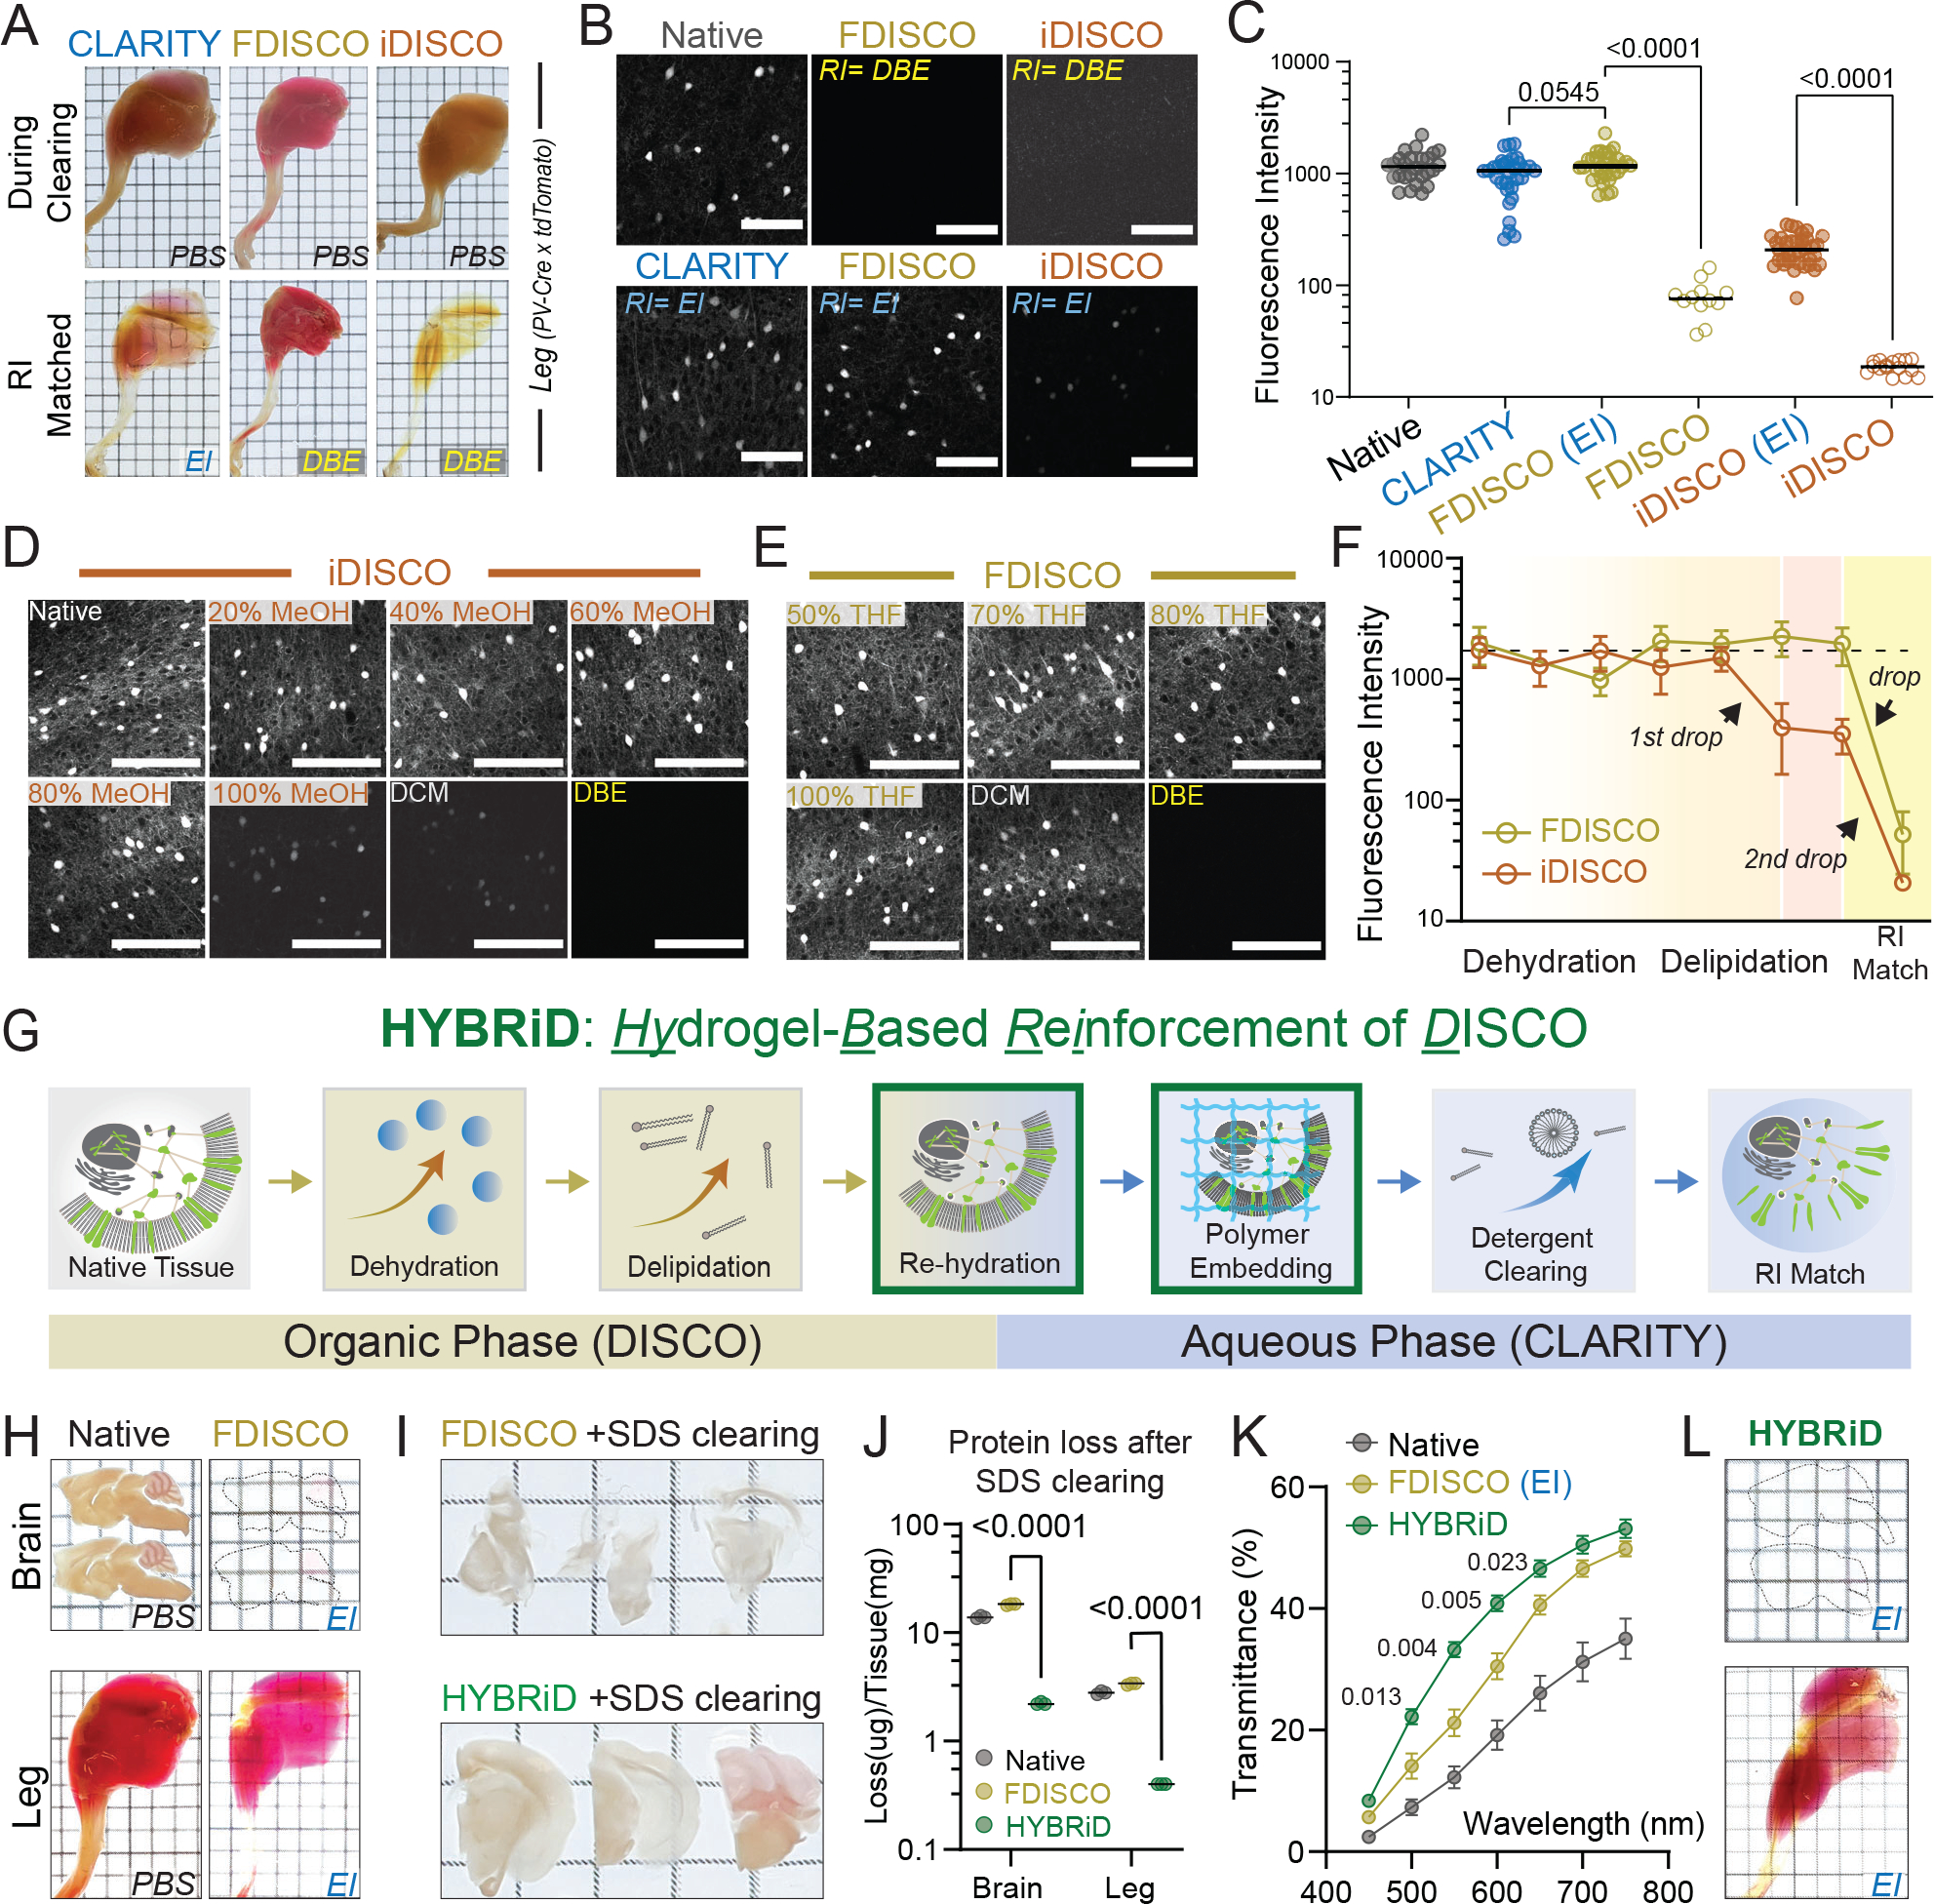
Fig. 1: Development and characterization of HYBRiD method.

A. Representative images of whole-mount adult PV-Ai9 hindlimbs processed by indicated protocols. EI: EasyIndex; DBE: dibenzyl ether.
B. Representative confocal images of 1mm PV-Ai9 brain slices processed by indicated protocols. Native samples were fixed in PFA without clearing. Showing tdTomato+ neurons in neocortex.
C. Quantification of fluorescence intensity of each condition in (B): Native (26), CLARITY (31), FDISCO (EI) (30), FDISCO (12), iDISCO (EI) (35), iDISCO (15). Data are presented as raw values and mean values. Statistical significance was determined by two-tailed t-tests.
D-E. Representative images and (F) quantification of time-course analysis of fluorescence quenching. 1mm brain slices were processed and stopped at individual timepoints. N = 10–16 for each step in each method. Data are presented as mean values ± SD.
G. Schematic of the HYBRiD protocol.
h. Representative images of PV-Ai9 brain slice and hindlimb before and after FDISCO.
I. Representative images of FDISCO (top) or HYBRiD (bottom) brain slices after 7 days of SDS treatment.
J. Quantification of protein loss during passive SDS clearing. Data are presented as raw values and mean values. Statistical significance was determined by two-tailed t-tests. N = 3 for each group.
K. Quantification of transparency of hindlimbs. All values are mean ± SEM, N =6 for each group. Statistical significance (false discovery rate) between HYBRiD and FDISCO was determined by multiple unpaired t-tests with two-stage step-up.
L. Representative images of PV-Ai9 brain slice and hindlimb processed by HYBRiD.
Grid size: 3mm; scale bar: 100 μm.
