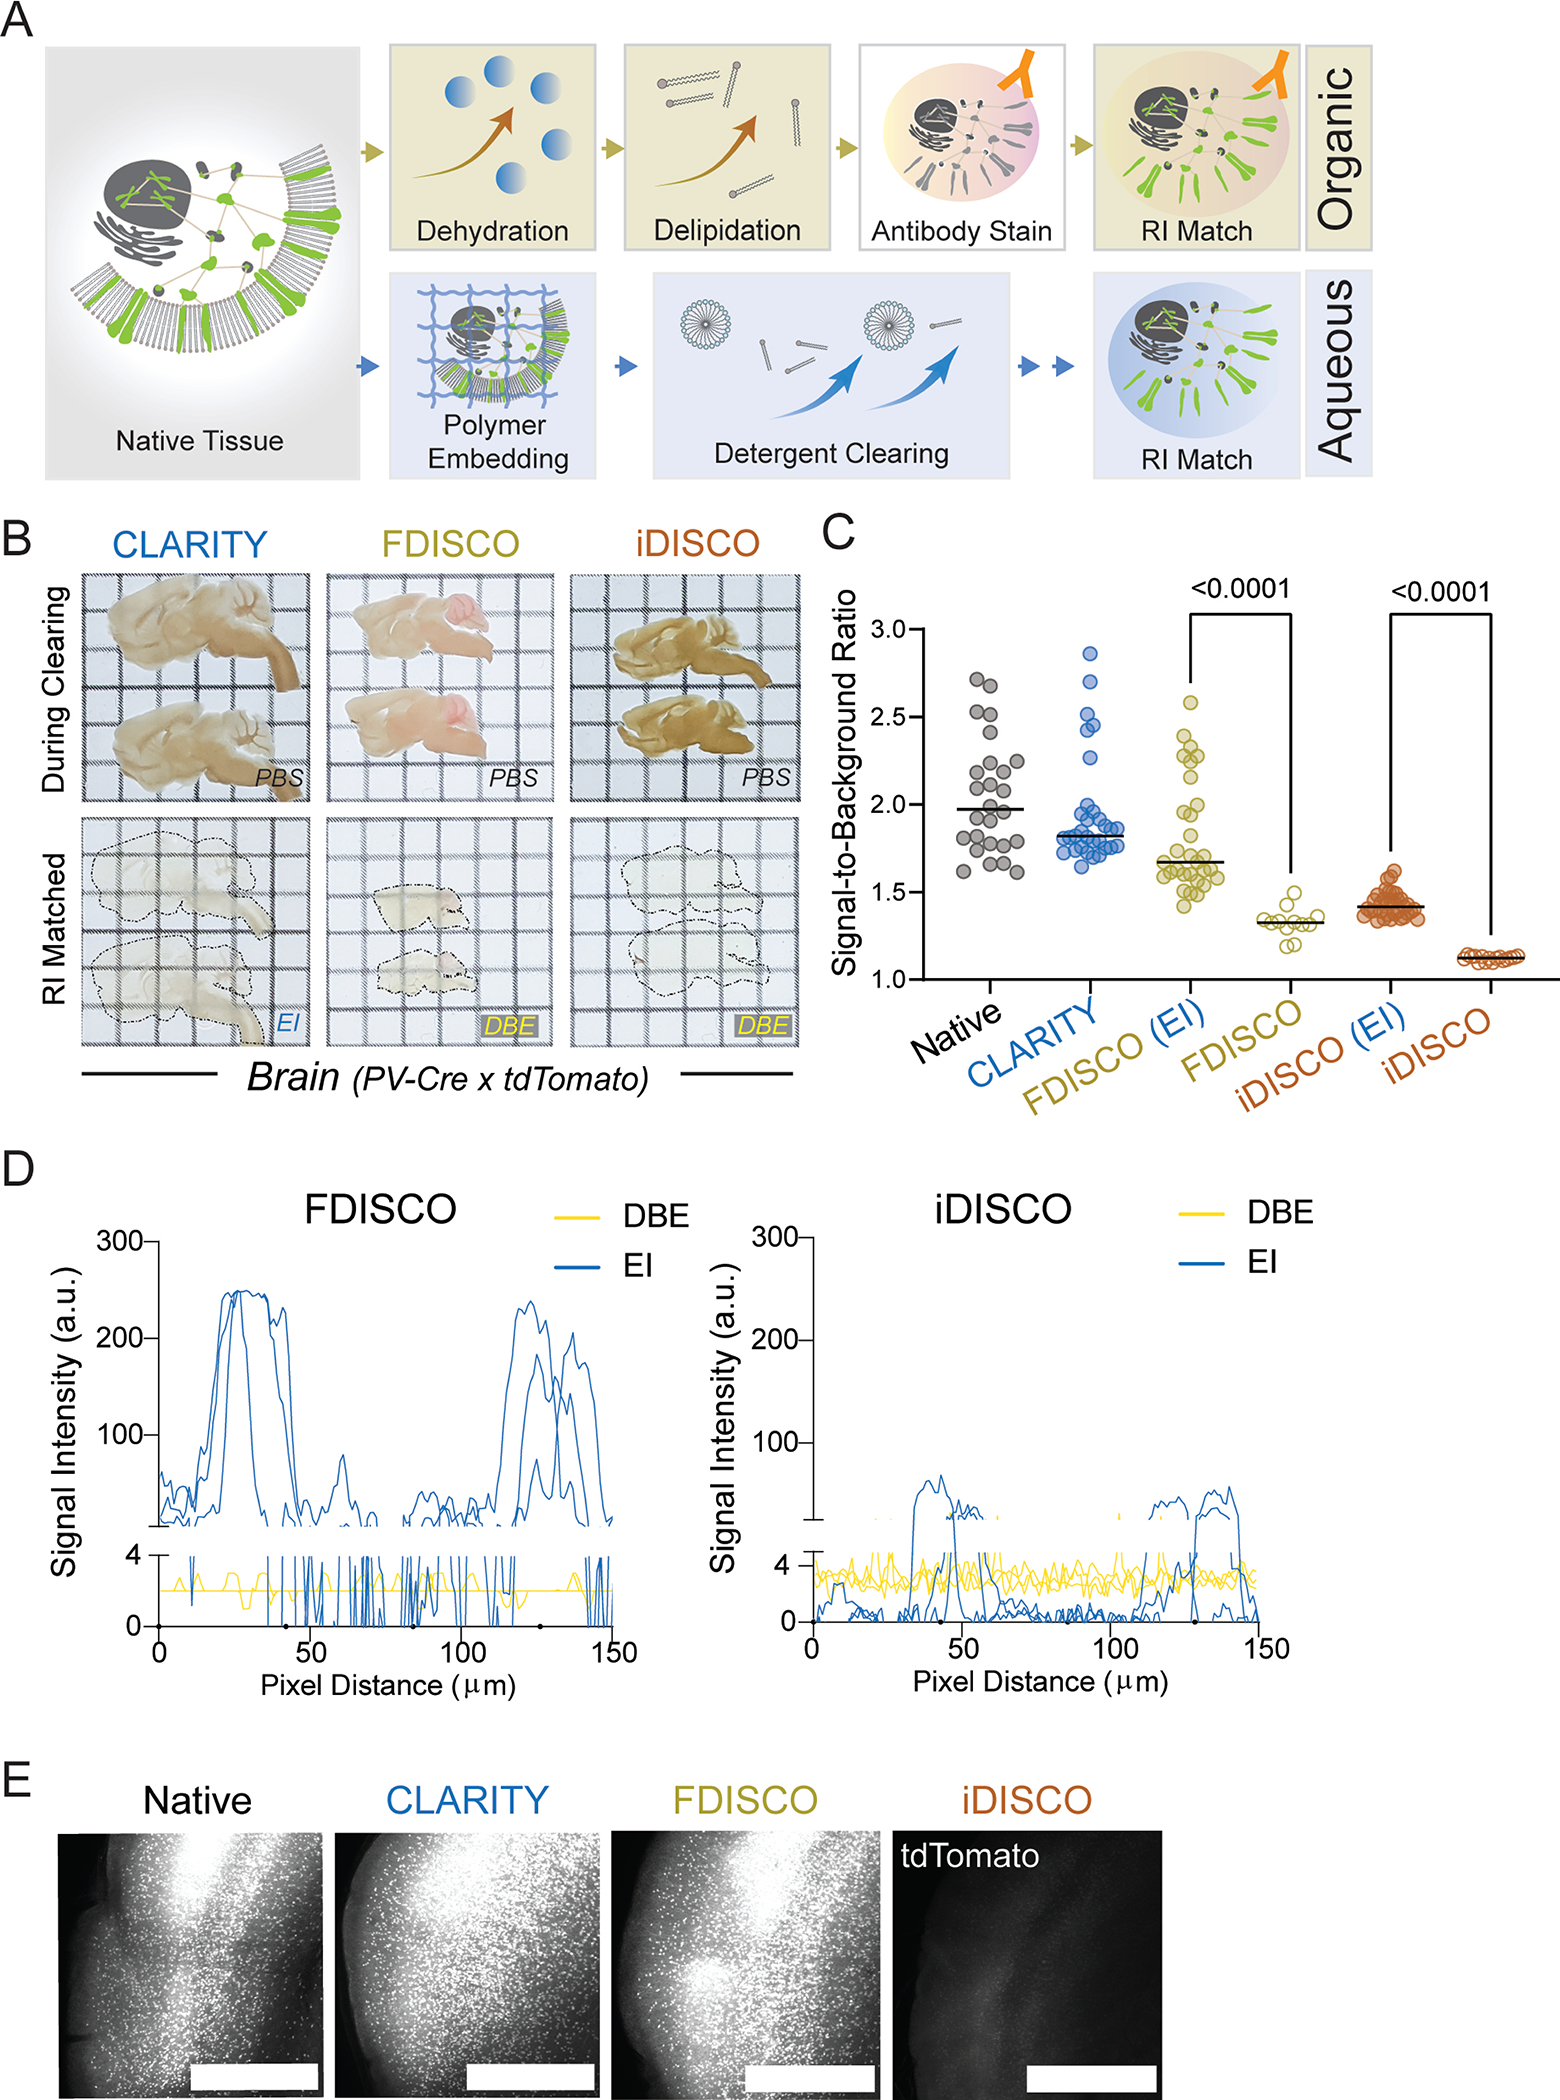
Extended Data Fig. 1. Development of HYBRiD.

A. Schematic of aqueous versus organic clearing protocols. Yellow: organic phase. Blue: aqueous phase. B. Representative images of 1 mm sagittal PV-Ai9 brain slices processed by indicated clearing protocols from 6 samples per group. EI: EasyIndex; DBE: dibenzyl ether. Grid size: 3 mm. C. Quantification of signal-to-background ratio of TdTomato fluorescence signal in PV-Ai9 brain slices processed by indicated clearing protocols. Native (n = 26), CLARITY (n = 31), FDISCO (EI) (n = 30), FDISCO (n = 12), iDISCO (EI) (n = 35), iDISCO (n = 15). (n indicates numbers of measurements from 6 samples per condition). Statistical significance was determined by two-tailed t-tests. D. Representative signal intensity profiles of FDISCO (left) and iDISCO (right) processed PV-Ai9 brain slices in either organic (DBE) or aqueous (EI) RI matching solution. N = 3 for each condition. E. Representative MIP confocal images of 1 mm PV-Ai9 brain slices processed by the indicated clearing methods from 6 samples per condition. Scale bar: 3 mm.
