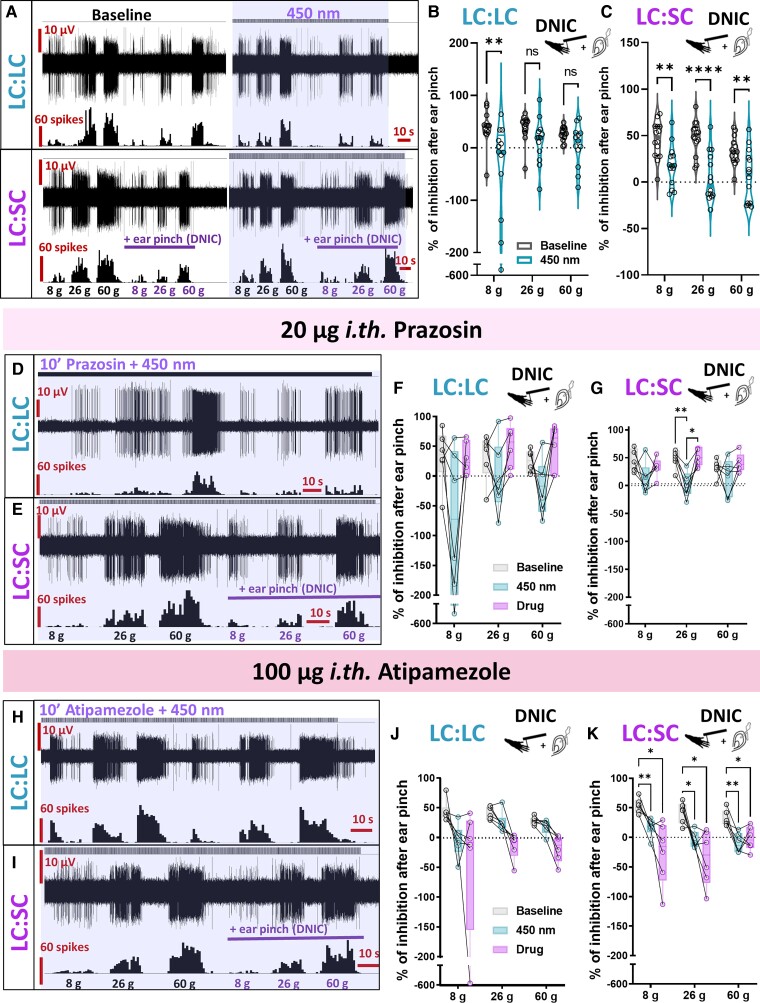
Figure 2.
DNIC expression is inhibited by LC:SC module optoactivation. (A) DNIC expression, quantified as the inhibitory effect of a conditioning stimulus (ear pinch), decreased following LC:LC module optoactivation (450 nm laser pulses), and was abolished following identical LC:SC module activation. (B) Percentage of inhibition after DNIC activation before/after LC:LC module activation. Mean ± SEM of n = 13 animals per group, n = 13 cells per group; two-way ANOVA performed on n, (450 nm) P < 0.01, F(1,36) = 10.75. (C) Identical experiments before/after the LC:SC module activation. Mean ± SEM of n = 14 animals per group, n = 14 cells per group; two-way ANOVA performed on n, (450 nm) P < 0.0001, F(1,39) = 46.01. Prazosin partially reversed the impact of (D) LC:LC or (E) LC:SC module activation on DNIC expression: (F) LC:LC prazosin: mean ± SEM shown as percentage of baseline for N = 6 animals per group, one cell per animal; two-way ANOVA with Geisser-Greenhouse correction (group) P < 0.05, F(1.38,6.91) = 8.056. (G) LC:SC prazosin: mean ± SEM shown as percentage of baseline for N = 6 animals per group, one cell per animal; two-way ANOVA with Geisser-Greenhouse correction (group) P < 0.05, F(1.17,5.87) = 8.215. The inhibitory effect of (H) LC:LC and (I) LC:SC module activation on DNIC expression was facilitated by spinal atipamezole: (J) LC:LC atipamezole: mean ± SEM shown as percentage of baseline for N = 6 animals per group, one cell per animal; two-way ANOVA with Geisser-Greenhouse correction (group) P > 0.05, F(1.06,5.31) = 4.950. (K) LC:SC atipamezole: mean ± SEM shown as percentage of baseline for N = 6 animals per group, one cell per animal; two-way ANOVA with Geisser-Greenhouse correction (group) P < 0.001, F(1.82,9.01) = 26.58. Tukey post hoc test used for all ANOVAs: *P < 0.05, **P < 0.01, ****P < 0.0001. See Supplementary Table 1.

