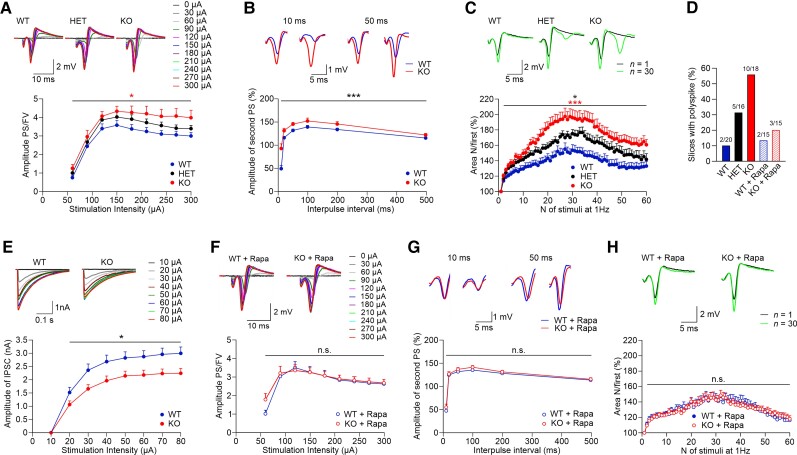
Figure 4.
Dose-dependent PI3K-C2β expression causes mTORC1-dependent hippocampal hyperexcitability. (A) Input–output relationships between stimulus intensities and the ratios of population spikes (PS) over fibre volley (FV) amplitudes show increased neuronal excitability in Pik3c2b KO mice. Two-way repeated measures (RM) ANOVA detected a significant difference between WT and KO mice [P= 0.013; WT n = 20 (slices) from N = 6 (mice); HET n = 16, N = 5; KO n = 18, N = 6]. Inset samples (above) show representative responses evoked by increasing stimulation intensities from 0 to 300 µA for each genotype. (B) Reduced paired-pulse modulation of population spikes in Pik3c2b KO mice. Representative traces of population spike paired-pulse modulation at 10 and 50 ms intervals show that the amplitudes of the second population spikes are greater in Pik3c2b KO mice, indicating reduced perisomatic feedback inhibition. Two-way RM ANOVA detected a significant difference between WT and KO mice (P < 0.001; WT n = 20 N = 6; KO n = 18, N = 6). (C) Activity-dependent facilitation of population spikes and appearance of polyspikes were significantly increased in KO (n = 18, N = 6) and HET (n = 16, N = 5) compared to WT (n = 20, N = 6) mice. Two-way RM ANOVA with P < 0.001 and P = 0.042, respectively. KO slices tended to facilitate more pronouncedly compared with HET (P = 0.065), indicating an effect of PI3K-C2β gene dosage on neuronal excitability. The areas of population spikes and polyspikes were calculated and given as ratios over the area of the first response during 1 Hz stimulation. Inset samples (above) show representative responses for each genotype evoked with 200 µA at first (black) and 30th stimuli (green). Note the appearance of polyspikes in HET and, more pronouncedly, in KO mice. (D) Fraction of slices (%) that display prominent (≥0.5 mV) polyspiking. The elevated fraction of slices with prominent polyspiking in KO mice is rescued by rapamycin (1 µM; N and n are as in C and H). (E) Representative IPSCs of both genotypes recorded from CA1 pyramidal neurons at stimulation intensities from 10 to 80 µA, showing reduced inhibitory synaptic transmission in Pik3c2b KO mice (top). Stimulation-evoked IPSCs (from 20 to 80 µA) are significantly reduced in Pik3c2b KO mice compared to WT littermates (bottom, two-way RM ANOVA P = 0.019; WT n = 13, N = 7; KO n = 14, N = 7). (F) The increased excitability of Pik3c2b KO mice is rescued by pretreatment with rapamycin (1 µM). Two-way RM ANOVA detected no significant difference between WT and KO mice (P = 0.705; WT n = 15, N = 5; KO n = 15, N = 5). Inset samples (above) show representative responses evoked by increasing stimulation intensities from 0 to 300 µA for each genotype. (G) Reduced paired-pulse modulation of population spikes in Pik3c2b KO mice is rescued by pretreatment of slices with rapamycin (1 µM). Representative traces of population spikes at 10 and 50 ms intervals show no difference in perisomatic feed-back inhibition. Two-way RM ANOVA detected no significant difference between WT and KO mice (P = 0.260; for N and n see F). (H) Increased activity-dependent facilitation of population spikes and polyspikes in Pik3c2b KO mice are rescued by pretreatment of slices with rapamycin (1 µM). Two-way RM ANOVA detected no significant difference between WT and KO mice (P = 0.968; for N and n see F). Inset samples (above) show representative responses for each genotype evoked with 200 µA at first (black) and 30th stimuli (green).

