Figure 5.
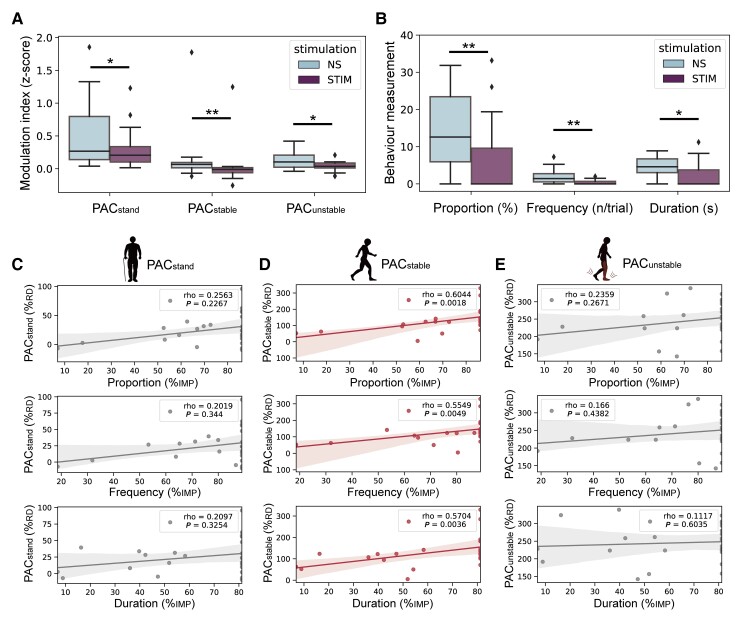
The reduction of PACstable predicts the improvement of freezing severity induced by DBS. (A) Box plots comparing PACstand, PACstable and PACunstable between no-stimulation (NS) and stimulation (STIM) conditions. (B) Box plots comparing freezing time proportion, freezing frequency and duration per freezing between NS and STIM conditions. Same conventions as in Fig. 2B. **P < 0.01, *P < 0.05, signed-rank test. (C) Regression plots showing the correlation between the percentage change of PACstand and the percentage change of freezing time proportion (top), freezing frequency (middle) and duration per freezing (bottom). (D) Regression plots showing the correlation between the percentage change of PACstable and the percentage change of freezing time proportion (top), freezing frequency (middle) and freezing duration (bottom). (E) Regression plots showing the correlation between the percentage change of PACunstable and the percentage change of freezing time proportion (top), freezing frequency (middle) and duration per freezing (bottom). Note that each patient has two data points resulting in 14 × 2 PAC values (n = 28), as the reduction of PAC was calculated in two stimulation conditions (i.e. HFS and LFS). Statistical dependence within subjects was accounted for using linear mixed effects models. Significant correlations after Bonferroni correction are marked in red. %RD = percentage reduction; %IMP = percentage improvement.

