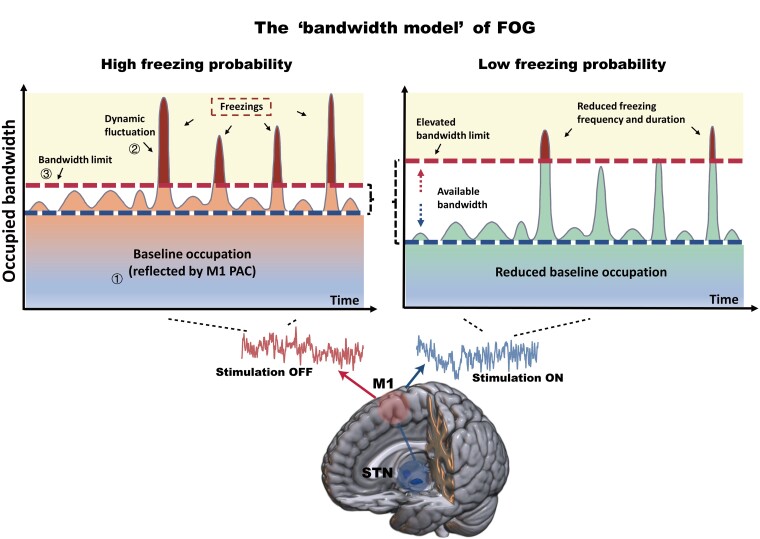
Figure 7.
A graphical representation of the proposed ‘bandwidth model’ of FOG. Three main elements constitute the model: (i) the baseline occupation; (ii) the dynamic fluctuation; and (iii) the bandwidth limit. The x-axis represents the time axis, and y-axis represents the occupied bandwidth. When baseline occupation plus dynamic fluctuation exceeds the bandwidth limit, freezing occurs. Baseline occupation can be quantified through M1 PAC. In the off-stimulation state (left), the baseline occupation (M1 PAC) maintains at a high level, leading to a high probability of exceeding the bandwidth limit. In the on-stimulation state (right), a reduction of baseline occupation and an elevation of bandwidth limit clean up larger available bandwidth that can be used to process dynamic fluctuation, leading to a lower probability of freezing.

