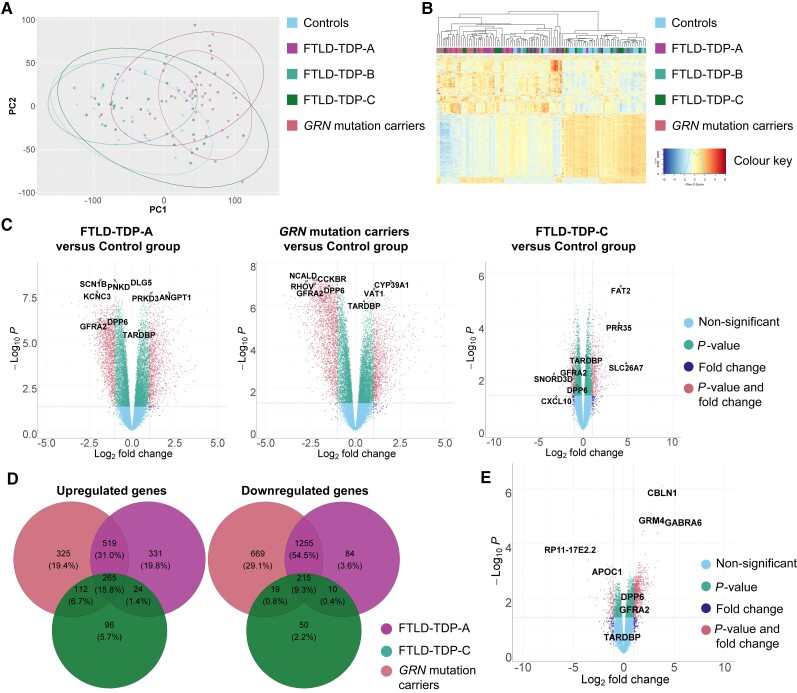
Figure 1.
Differential expression in FTLD-TDP groups versus controls. (A) Principal component (PC) 1 is represented on the x-axis and principal component 2 on the y-axis. Individuals with GRN mutation and pertaining to the FTLD-TDP-A group are coloured in pink and purple. Individuals pertaining to the FTLD-TDP-B and FTLD-TDP-C groups are coloured in light and dark green. Control individuals are coloured in blue. Ellipses delimit the different groups and are coloured accordingly. (B) Cluster analysis of all samples using the top 1000 most variable genes. Individuals with GRN mutation are coloured in pink, FTLD-TDP-A patients are coloured in purple. Individuals pertaining to the FTLD-TDP-B and FTLD-TDP-C groups are coloured in light and dark green, respectively. Control individuals are coloured in blue. Heat map rows show standardized expression levels of individual genes with red denoting high expression, yellow denoting medium expression and blue denoting low expression levels. (C) Volcano plots representing the differentially expressed genes in FTLD-TDP-A, GRN mutation carriers and FTLD-TDP-C groups versus control group. The fold change is presented in a log2 scale at the x-axis, while the FDR adjusted P-value is presented on the y-axis on a −log10 scale. (D) Venn diagram showing the overlap of up- and downregulated genes between groups (FTLD-TDP-A in purple, GRN mutation carriers in pink and FTLD-TDP-C in light green) as compared to controls. (E) Volcano plots representing the differentially expressed genes in GRN mutation carriers versus FTLD-TDP-C group.

