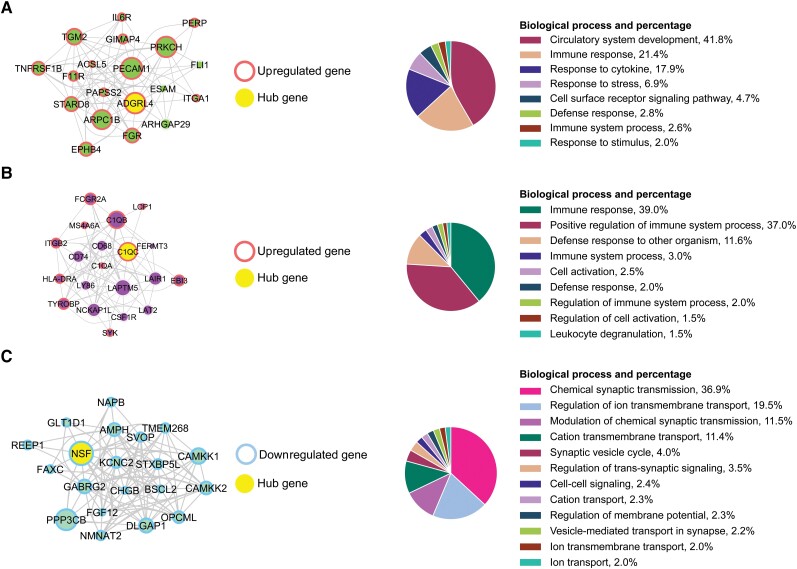
Figure 4.
Top hub genes from the coexpression analyses of FTLD-TDP-A with and without GRN mutation. (A) Top 20 hub genes for the green module are displayed. (B) Top 20 hub genes for the purple module are displayed. (C) Top 20 hub genes for the turquoise module are displayed. The size of the node is proportional to the connectivity of the gene. The strength of the correlation between two genes (nodes) is reflected by the thickness of the edge. Hierarchical GO analysis of biological process terms is presented on the right. Upregulated genes are circled in red and downregulated genes in blue. The main hub gene is coloured in yellow. Hierarchical GO analysis of biological process terms is presented on the right.

