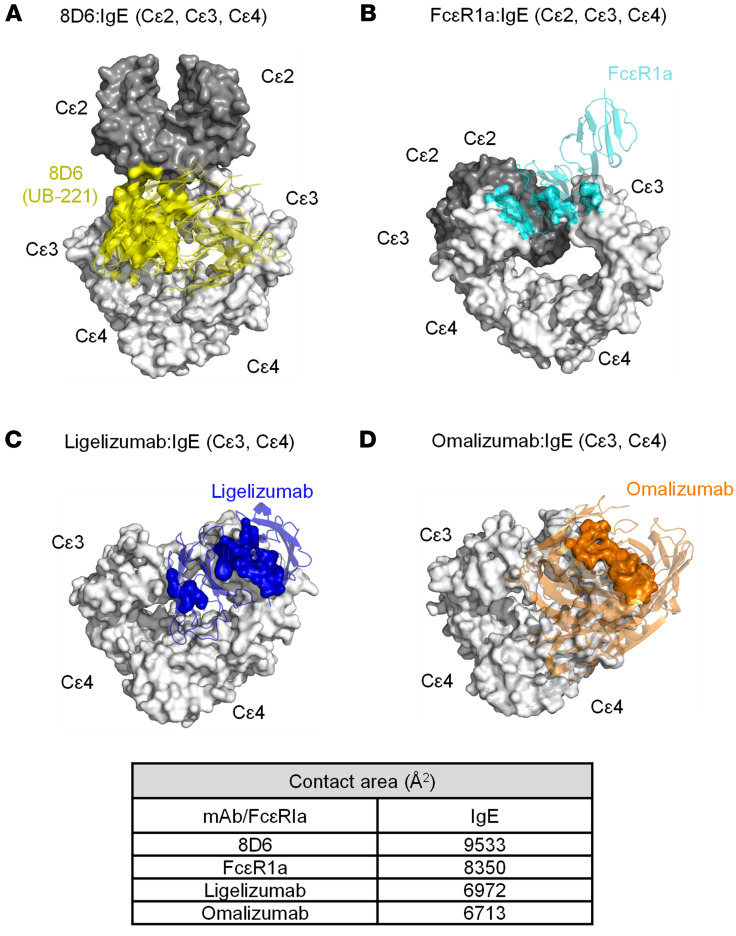
Figure 10. Superposed 3D structures of the mAb-IgE complex and contact interfaces of IgE bound with the 3 mAbs and FcεR1α.
The 3D illustrations of 3 mAb-IgE and FcεR1α-IgE complex structures were generated using the Protein Data Bank accession numbers 6EYO (8D6:IgE), 6UQR (ligelizumab:IgE), 5HYS (omalizumab:IgE), and 2Y7Q (FcεR1α:IgE). 8D6 (yellow), ligelizumab (blue), omalizumab (brown), and FcεR1α (cyan) are shown in ribbon format. The structures were generated using the PyMOL program. IgE molecule is shown in surface format with Cε2 (dark gray) and Cε3-Cε4 (gray). (A) The Fab of 8D6 contacts both the Cε2 domain and Cε2-Cε3 linker of the IgE molecule (yellow), which exhibits a fully extended conformation. (B) FcεR1α binds the Cε3 domain of IgE, which adopts a bent conformation. (C) Ligelizumab (blue) and (D) omalizumab (brown) bind an IgE molecule with similar contact areas. Interfacial areas were calculated with AREAIMOL in the CCP4 program suite. The contact areas were calculated on the van der Waals surface of an atom within 3.8 Å. 8D6 interfaces with IgE with the greatest contact area (9,533 Å2), followed by FcεR1α (8,350 Å2), ligelizumab (6,972 Å2), and omalizumab (6,713 Å2).

