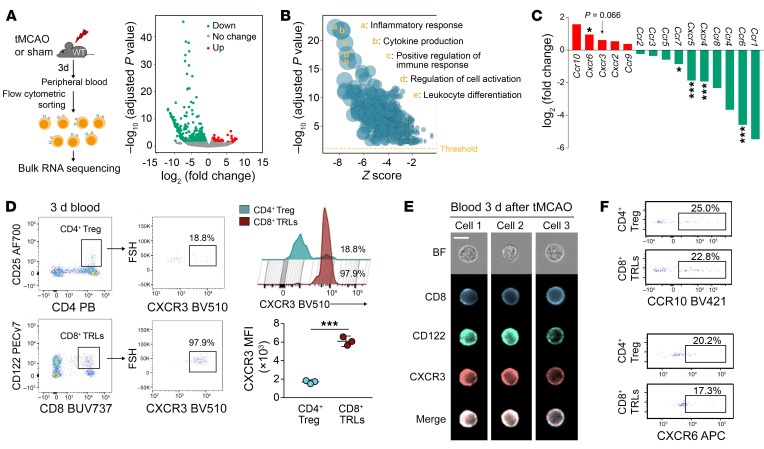
Figure 2. CXCR3 is upregulated in circulating CD8+ TRLs after stroke.
(A) CD8+ TRLs were sorted from mouse blood 3 days after tMCAO or sham operation for RNA-seq analysis. Red and green dots in the volcano plot represent transcripts expressed at higher or lower levels in stroke blood versus sham blood CD8+ TRLs, respectively (adjusted P < 0.05, |fold change| > 2). (B) Gene Ontology analysis of the differentially expressed genes (DEGs). (C) The expression of several chemokine receptors on CD8+ TRLs from stroke blood compared to sham blood. (D) Flow cytometric analysis of CXCR3+ cells among CD8+ TRLs and CD4+ Tregs in the blood 3 days after tMCAO. The mean fluorescence intensity (MFI) of CXCR3 among CD8+ TRLs and CD4+ Tregs in the ischemic brain was quantified. n = 3/group. Two-tailed Student’s t test. (E) Representative ImageStream images show expression of CXCR3, CD8, and CD122 in 3 blood cells collected 3 days after tMCAO. Scale bar: 10 μm. (F) Flow cytometric analysis of CCR10 and CXCR6 in CD8+ TRLs and CD4+ Tregs in blood 3 days after tMCAO. The plots represent 2 independent experiments. *P < 0.05; ***P < 0.001.

