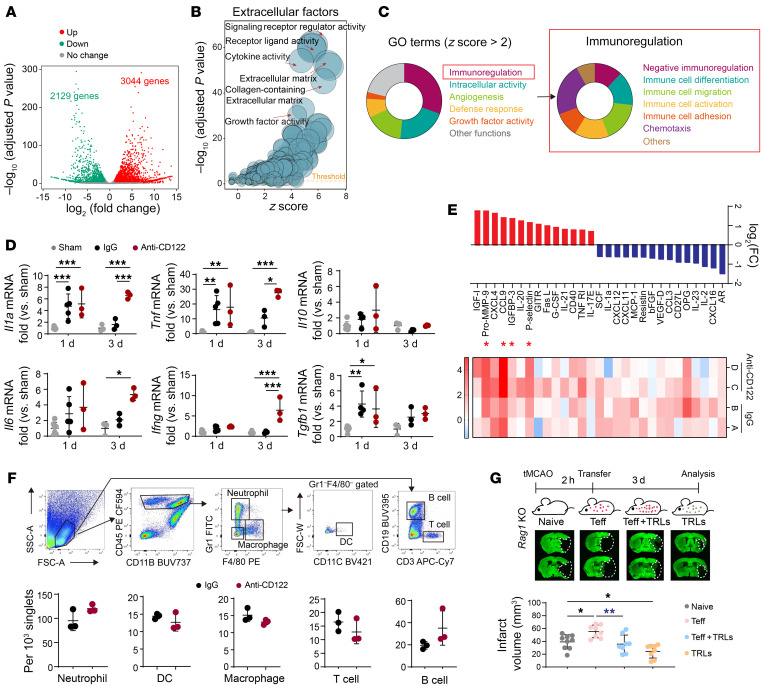
Figure 4. CD8+ TRLs confer neuroprotection after tMCAO through a combination of antiinflammatory and inflammation-independent mechanisms.
(A–C) Single-cell suspensions were prepared from mouse blood and brain 3 days after sham or tMCAO. Sorted CD8+ TRLs were analyzed by RNA-seq. n = 2 in each group. (A) Volcano plot showing differentially expressed genes (DEGs) between brain-infiltrating TRLs and blood TRLs (adjusted P < 0.05, |fold change| > 2). (B) Gene Ontology (GO) analyses of DEGs encoding extracellular factors. (C) GO analyses showing the immunoregulatory function of brain-infiltrating CD8+ TRLs. (D–F) Mice were treated with isotype IgG (100 μg) or anti-CD122 mAb (100 μg) 2 days prior to 60-minute tMCAO. (D) Quantitative RT-PCR analysis for Il1a, Tnf, Ifng, Il6, Il10, and Tgfb1 mRNA expression at 1 or 3 days after tMCAO. n = 3–7/group. Two-way ANOVA and post hoc Bonferroni’s test. (E) Protein array analysis 3 days after tMCAO. Heatmap and bar graphs demonstrating proteins with greater than 2-fold changes (red, upregulated; blue, downregulated) in anti-CD122–treated mice versus IgG-treated mice after stroke. n = 3–5/group. Red asterisks indicate proteins that were significantly upregulated with a false discovery rate (FDR) < 0.2. (F) Infiltration by Gr1+ neutrophils, CD11c+ DCs, F4/80+ macrophages, CD3+ T lymphocytes, and CD19+ B lymphocytes into the ischemic brain was quantified by flow cytometry 3 days after tMCAO. n = 3/group. Two-tailed Student’s t test. (G) CD3+CD122–CD25– Teff cells (1 million) or PBS were transferred into Rag1–/– mice 2 hours after tMCAO, which was followed by i.v. infusion of PBS or CD8+ TRLs (0.5 million). Brain infarcts were quantified on MAP2-stained brain sections collected 3 days after tMCAO. n = 8–9/group. One-way ANOVA and post hoc Bonferroni’s test. *P < 0.05; **P < 0.01; ***P < 0.001.

