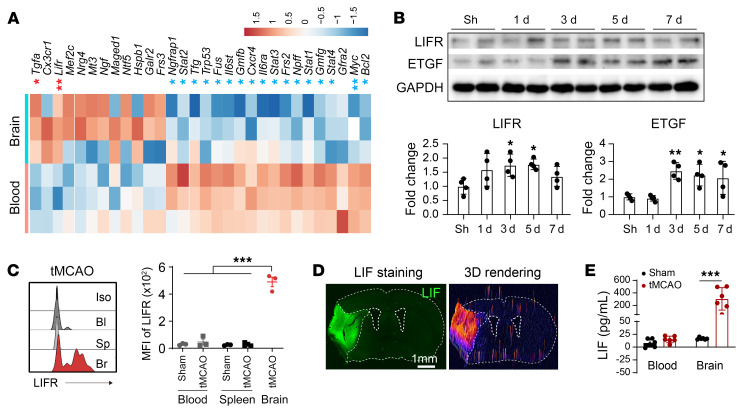
Figure 5. LIFR and ETGF are upregulated in CD8+ TRLs after stroke.
(A) CD8+ TRLs from ischemic brain 3 days after tMCAO and from blood after sham operation were subjected to quantitative PCR array. The gene expression was normalized to the corresponding blood level. Heatmap showing the log2(fold change) for genes with >2-fold changes. n = 3/group. *FDR < 0.2, **FDR < 0.1 for genes upregulated (red) or downregulated (blue) in brain-infiltrating CD8+ TRLs. (B) Western blot analysis of LIFR and ETGF expression in the brain lysates collected from sham mice and 1, 3, 5, and 7 days after stroke. n = 4/group. One-way ANOVA and post hoc Dunnett’s test. (C) MFI of LIFR in CD8+CD122+ TRLs in the blood (Bl), spleen (Sp), and ipsilateral brains (Br) 3 days after tMCAO or sham operation. One-way ANOVA and post hoc Dunnett’s test. Iso, isotype control. (D) Immunostaining of LIF 3 days after stroke. Images are representative of 4 animals in each group. (E) Expression of LIF was assessed by ELISA 3 days after tMCAO. n = 6/group. One-way ANOVA and post hoc Bonferroni’s test. *P < 0.05; **P < 0.01; ***P < 0.001.

