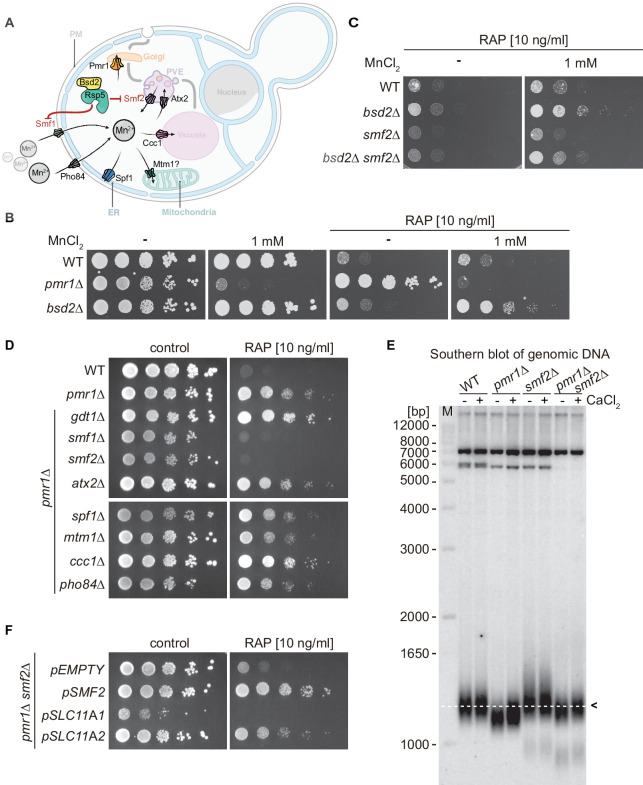
Figure 1. Natural resistance-associated macrophage protein (NRAMP) transporters link Mn2+-import to rapamycin resistance.
(A) Schematical outline of yeast Mn2+ transporters and their intracellular localization. PM, plasma membrane; PVE, pre-vacuolar endosomes; ER, endoplasmic reticulum. Note that Bsd2 is a specific adaptor protein for Rsp5-mediated Smf1 and Smf2 ubiquitination in response to Mn2+ overload. The Golgi Mn2+ transporter Gdt1 is omitted for clarity. (B–D) Growth on MnCl2 and/or rapamycin-containing medium (RAP). Ten-fold dilutions of exponentially growing cells are shown. Strains and compound concentrations are indicated. Note that the medium used in (D) was supplemented with 10 mM CaCl2. Data obtained in a medium without CaCl2 are shown in Figure 1—figure supplement 3. (E) Southern blot analysis of telomere length. Genomic DNA was derived from cells grown in a medium supplemented or not with CaCl2 and cleaved by XhoI before agarose gel electrophoresis. The 1.3 kb average length of telomeres from WT cells (dashed white line, black arrow) and size marker (M) are shown. (F) Growth of pmr1∆ smf2∆ double mutants transformed with plasmids expressing yeast Smf2, Mus musculus SLC11A1, or SLC11A2 on rapamycin-containing medium. Complementary data showing that pmr1∆ rapamycin resistance is not linked to Gap1 or Tor1 localization is provided in Figure 1—figure supplement 1. Rapamycin sensitivity of bsd2∆ cells overexpressing the Vcx1-M1 transporter are shown in Figure 1—figure supplement 2.
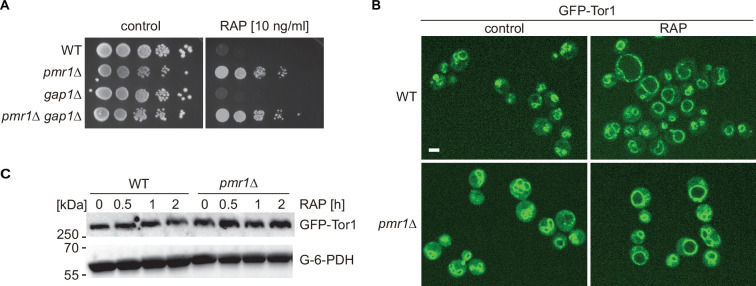
Figure 1—figure supplement 1. pmr1∆ rapamycin resistance is not linked to Gap1 or Tor1 localization.
Figure 1—figure supplement 2. Growth of bsd2∆ mutants expressing Vcx1-M1 from plasmid pVCX1-M1 on MnCl2 and/or rapamycin (RAP) containing medium.
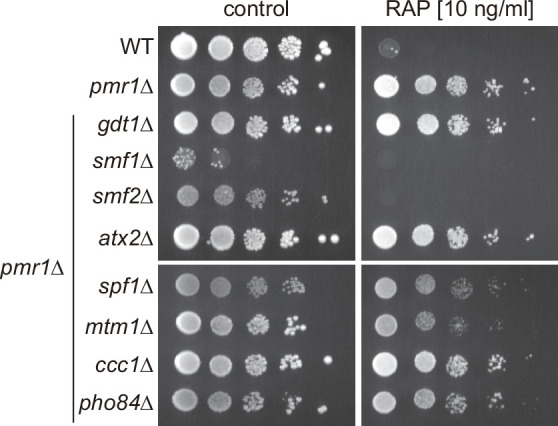
Figure 1—figure supplement 3. Natural resistance-associated macrophage protein (NRAMP) transporters mediate rapamycin resistance of pmr1∆ mutants.


