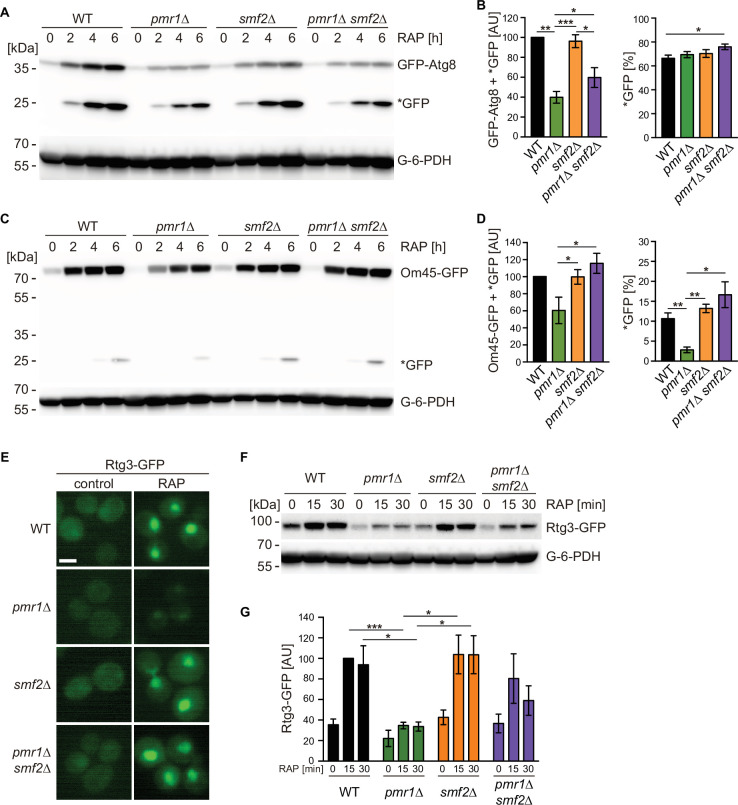
Figure 2. Intracellular manganese (Mn) excess antagonizes rapamycin-induced autophagy, mitophagy, and Rtg1-3 retrograde signaling.
(A) Exponentially growing WT and indicated mutant strains expressing plasmid-encoded GFP-Atg8 were treated for up to 6 hr with 200 ng/ml rapamycin (RAP). GFP-Atg8 and cleaved GFP (*GFP) protein levels were analyzed by immunoblotting. Glucose-6-phosphate dehydrogenase (G-6-PDH) levels were used as a loading control. (B) Quantification of GFP-Atg8 and *GFP levels after a 6 hr rapamycin treatment. Total GFP signal (Atg8-GFP + *GFP) normalized to WT levels (left) and percentage of *GFP relative to the total GFP signal (right) are plotted. Data represent means ± SEM of independent experiments (n=4). Statistical analysis: two-tailed t-test (paired for normalized data, unpaired for GFP* percentage). *p<0.05; **p<0.01; ***p<0.001. (C) Exponentially growing WT and indicated mutant strains expressing Om45-GFP from the endogenous locus were treated and processed as in (A). (D) Quantification of Om45-GFP and *GFP levels after a 6 hr rapamycin treatment. Details as in (B) with n=3. (E) Representative fluorescence microscope images of WT, pmr1∆, smf2∆, and pmr1∆ smf2∆ mutants expressing an episomic Rtg3-GFP reporter construct. Exponentially growing cells were treated or not (control) for 30 min with 200 ng/ml rapamycin (RAP). Scale bar represents 5 µm. (F) Rtg3-GFP expressing cells were treated for up to 30 min with 200 ng/ml rapamycin. Protein levels were analyzed by immunoblotting. G-6-PDH levels were used as a loading control. (G) Quantification of Rtg3-GFP signals. Values normalized to WT levels after 15 min of rapamycin treatment (highest signal) are plotted. Data represent means ± SEM of independent experiments (n=4). Statistical analysis: paired two-tailed t-test.

